One must admit that the availability of easy-to-use business intelligence and data visualization tools like MS Power BI, Tableau, Qlik among many others, has provided project stakeholders with a great opportunity to consume data captured on capital construction projects to dice, slice, analyze and visualize the data in the way they want to improve their insight to make better and faster-informed decisions. The ease of using those business intelligence tools as well as being available for free has encouraged many project stakeholders to use tools to have their own version of reports and dashboards.
Although many might argue that project reports and dashboards used by stakeholders should be standardized and made ready for them to use, nevertheless, those stakeholders have their own experience and knowledge in delivering capital construction projects and therefore, they will always need to view data from their perspectives.
In addition, the growing use of Project Management Information Systems (PMIS) like PMWeb has also provided those project stakeholders with the great opportunity to capture every piece of data associated with the hundreds of business processes needed to manage the delivery of capital construction projects. Those include the business processes needed to manage project scope, schedule, cost, quality, communications, resources, risks, procurement, contracts, health, safety and environment (HSE), claims, financial among others. The capturing of this big data is done by using pre-defined input templates that will enforce transparency and accountability for which will ensure having real-time, trustworthy, and traceable data to be reported on.
To ensure the security and protection of the data captured in a PMIS like PMWeb, there will be always restrictions on who can access the database which could include the data for all business processes used to manage programs, projects and contracts and for which access will differ for the project stakeholders. In addition, the PMIS database tables and fields could be excessive and not easy for project stakeholders to use on their own. Therefore, the PMIS data needed by those project stakeholders to their dice, slice, analysis, and visualization should be provided in an easy-to-use format like the MS Excel file format.
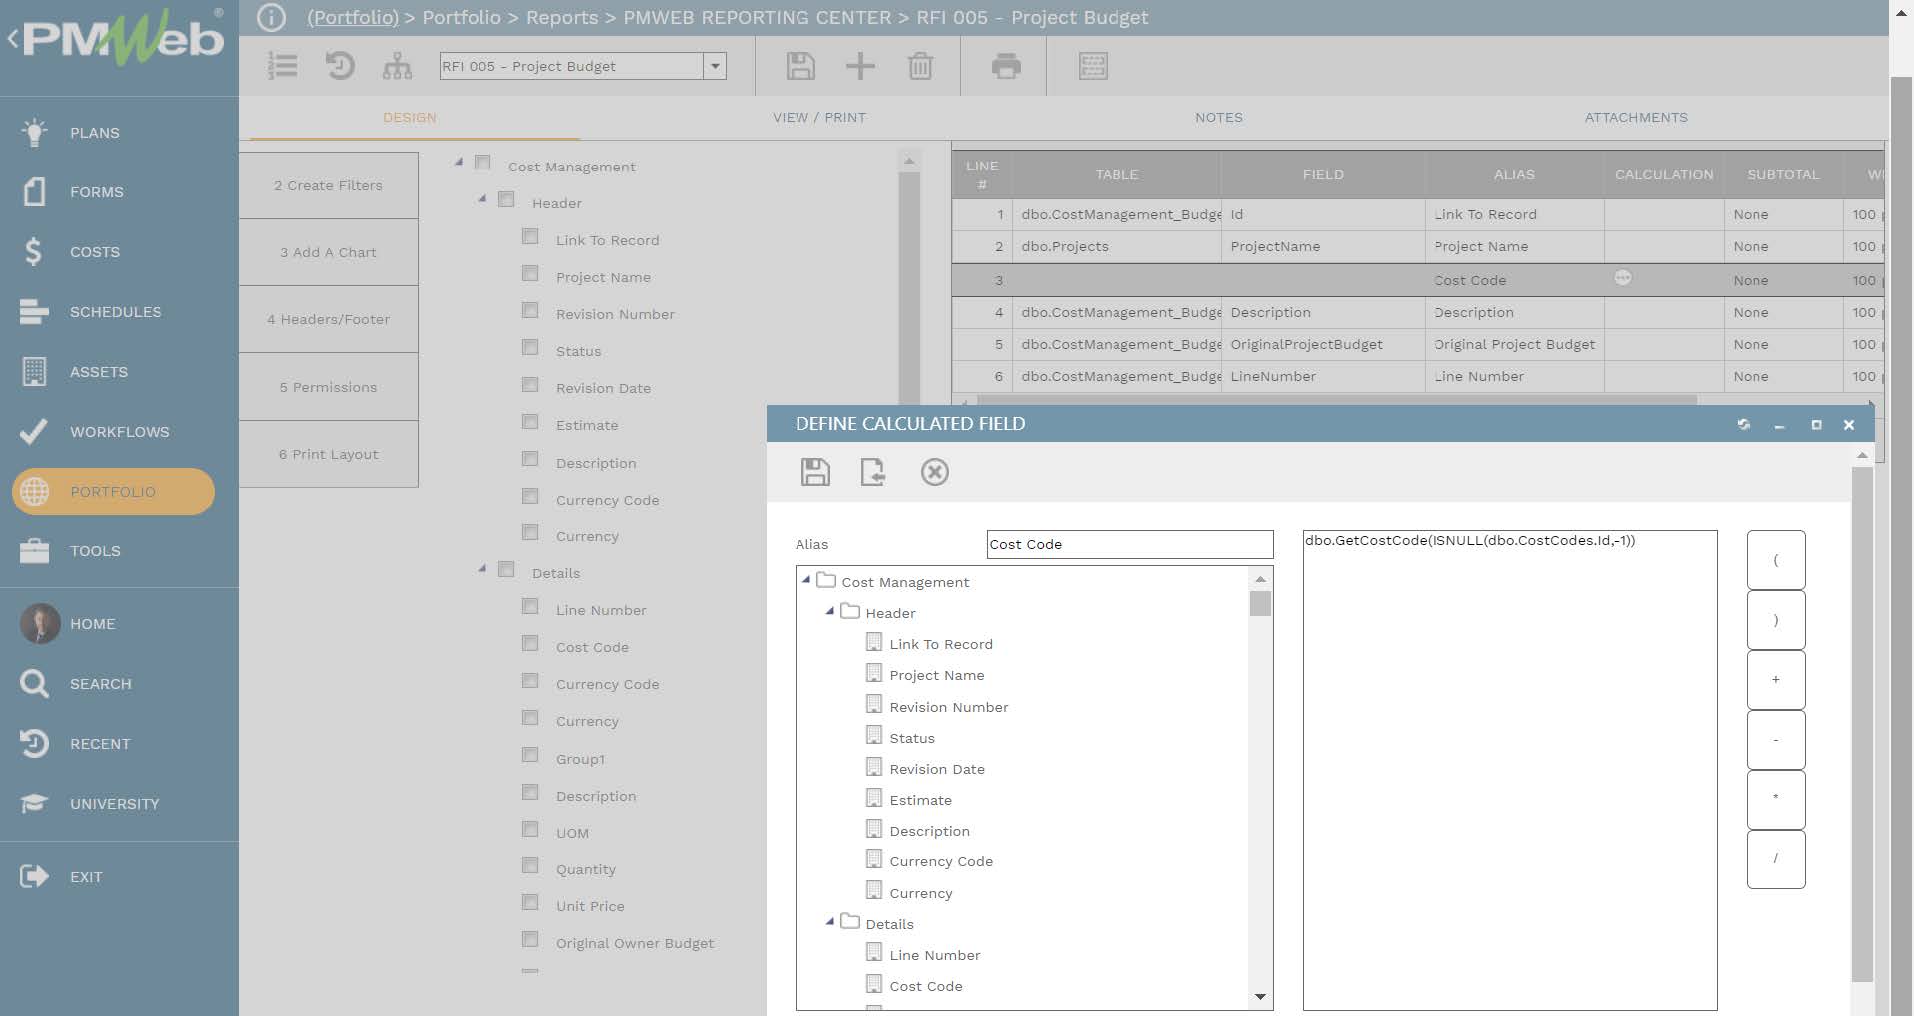
In addition to PMWeb Business Intelligence reporting which is powered by MS SQL Reporting Services (rated as the leader in BI by Gartner for 11 consecutive years), PMWeb comes also with a quick no-coding report writer. For those who will be authorized to access this report writer, they will be able to create tabular reports for each process managed in PMWeb. This applies to PMWeb default processes or those created using PMWeb custom form builder. The data fields for each table can be dragged and dropped in the desired sequence as well as it allows creating calculated fields by addition the formulas to calculate those fields. Filters can be also added to the report to limit the selection of the data to be displayed.
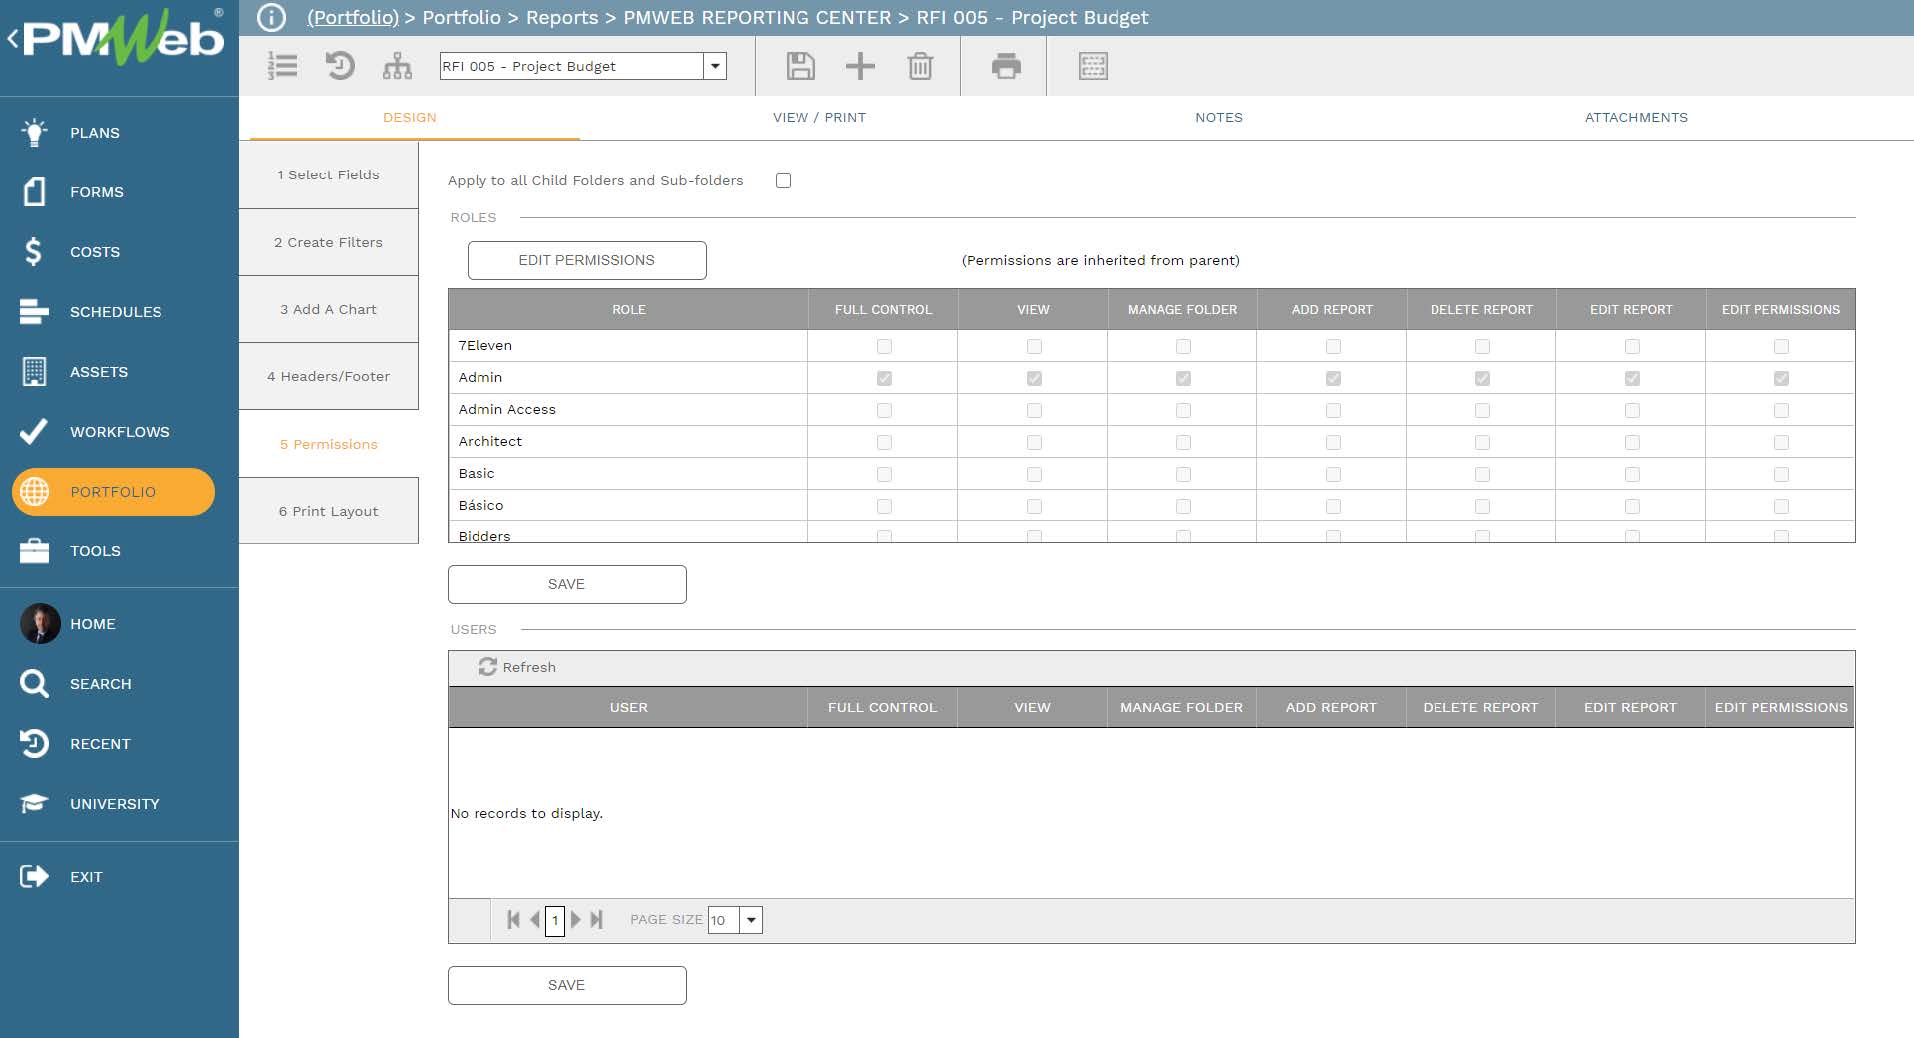
Since the data that will become part of the created report could be restricted and not to be shared with other project stakeholders, PMWeb allows setting the access rights by project role as well as by specific PMWeb user name to reach created report. Those permissions could include the options to view, edit, delete among others.
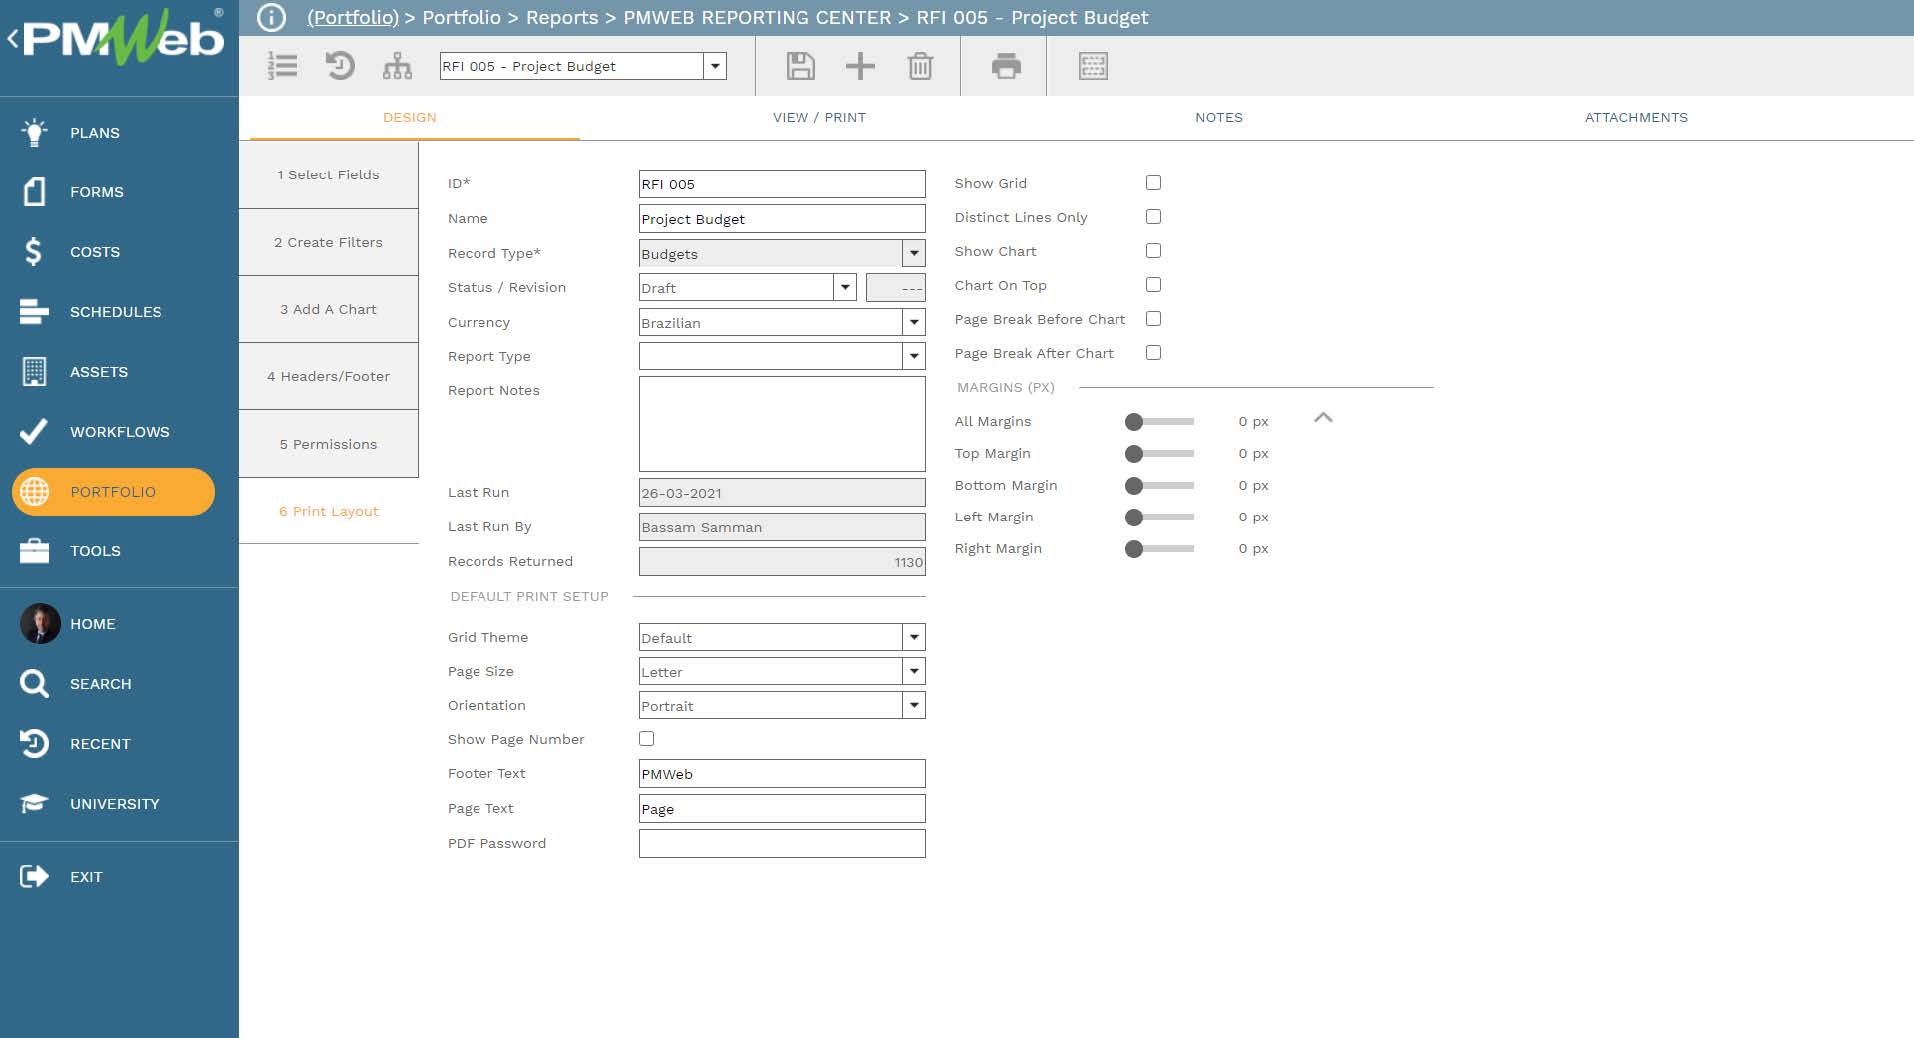
In addition, PMWeb allows defining the report print layout including orientation, page size, headers and footers, margin, whether charts to be shown among others. In addition, it provides the option of selecting the password if the report will be saved in PDF file format.
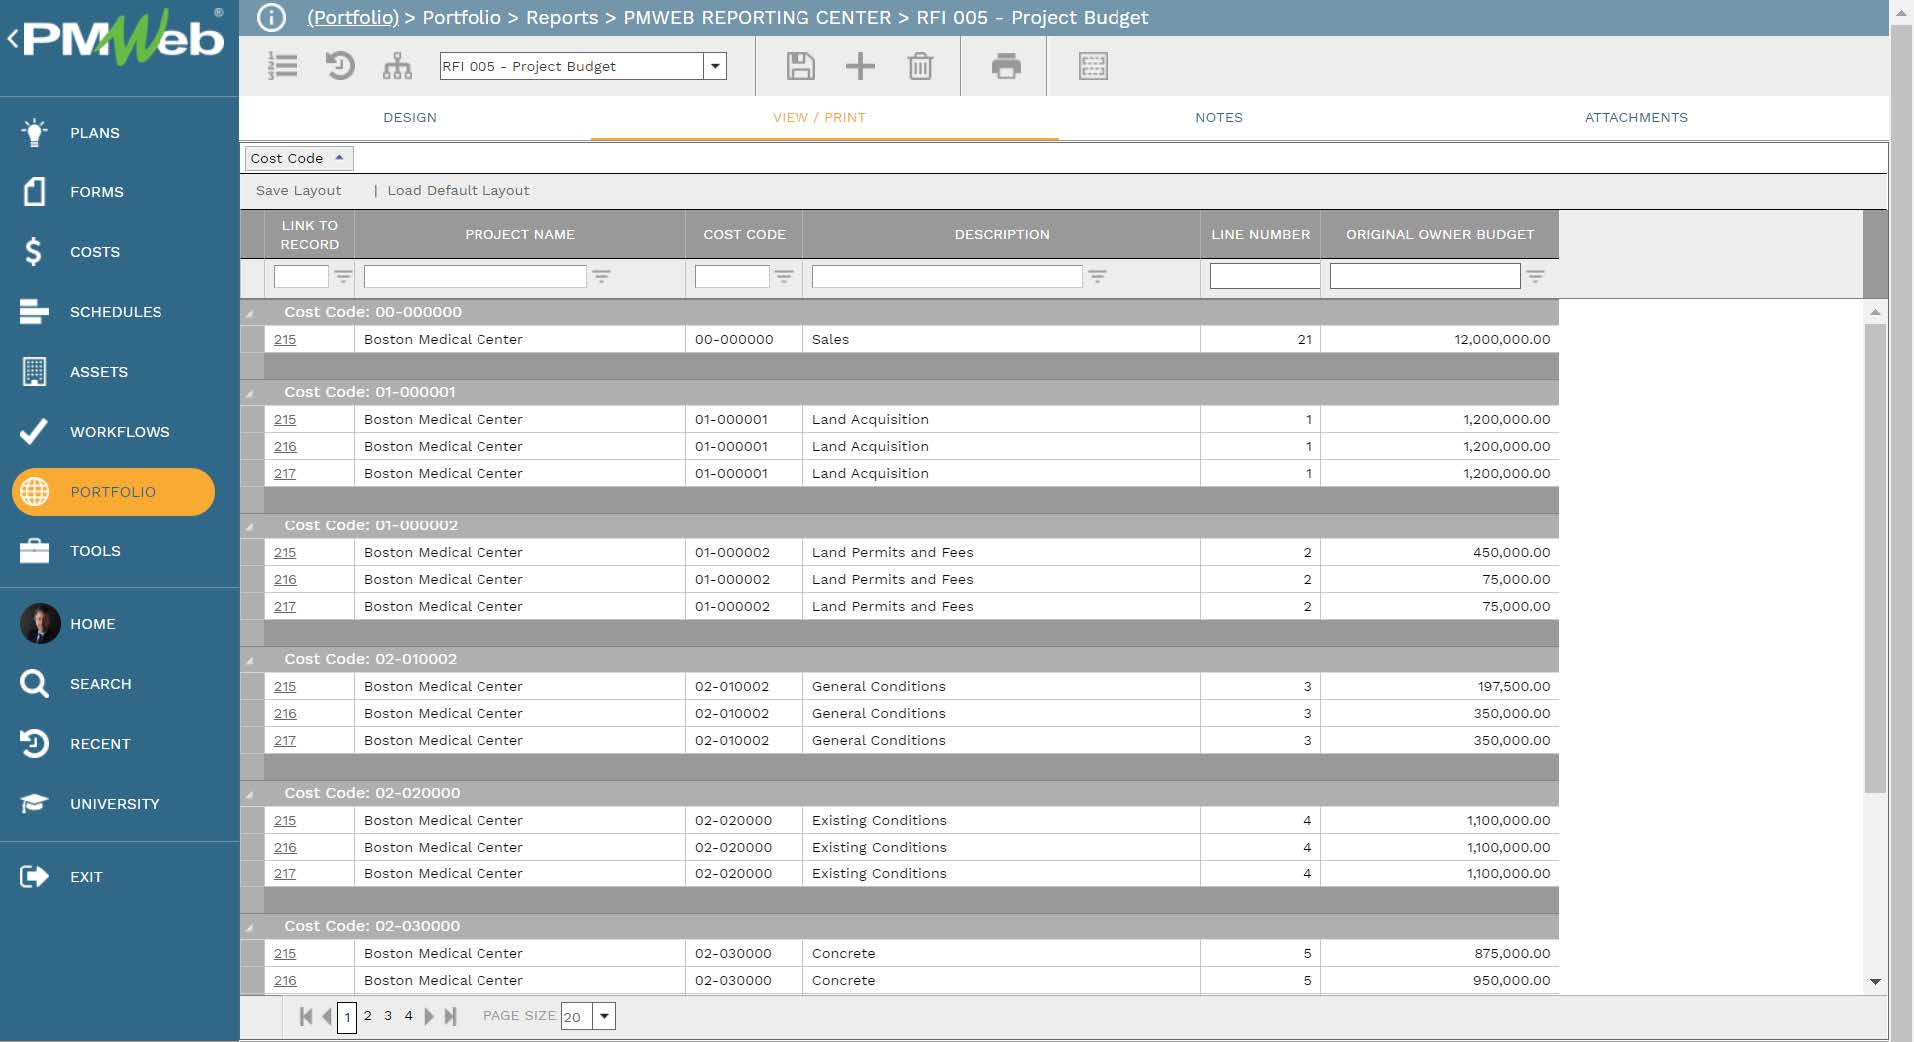
To review the data fields selected to be displayed in the report including the calculated fields and added filters, the view command will be selected. The data can be grouped by the selected data fields by simply dragging and dropping the fields in the group space. At this point, the report is done and ready to be made available for authorized project stakeholders to access.
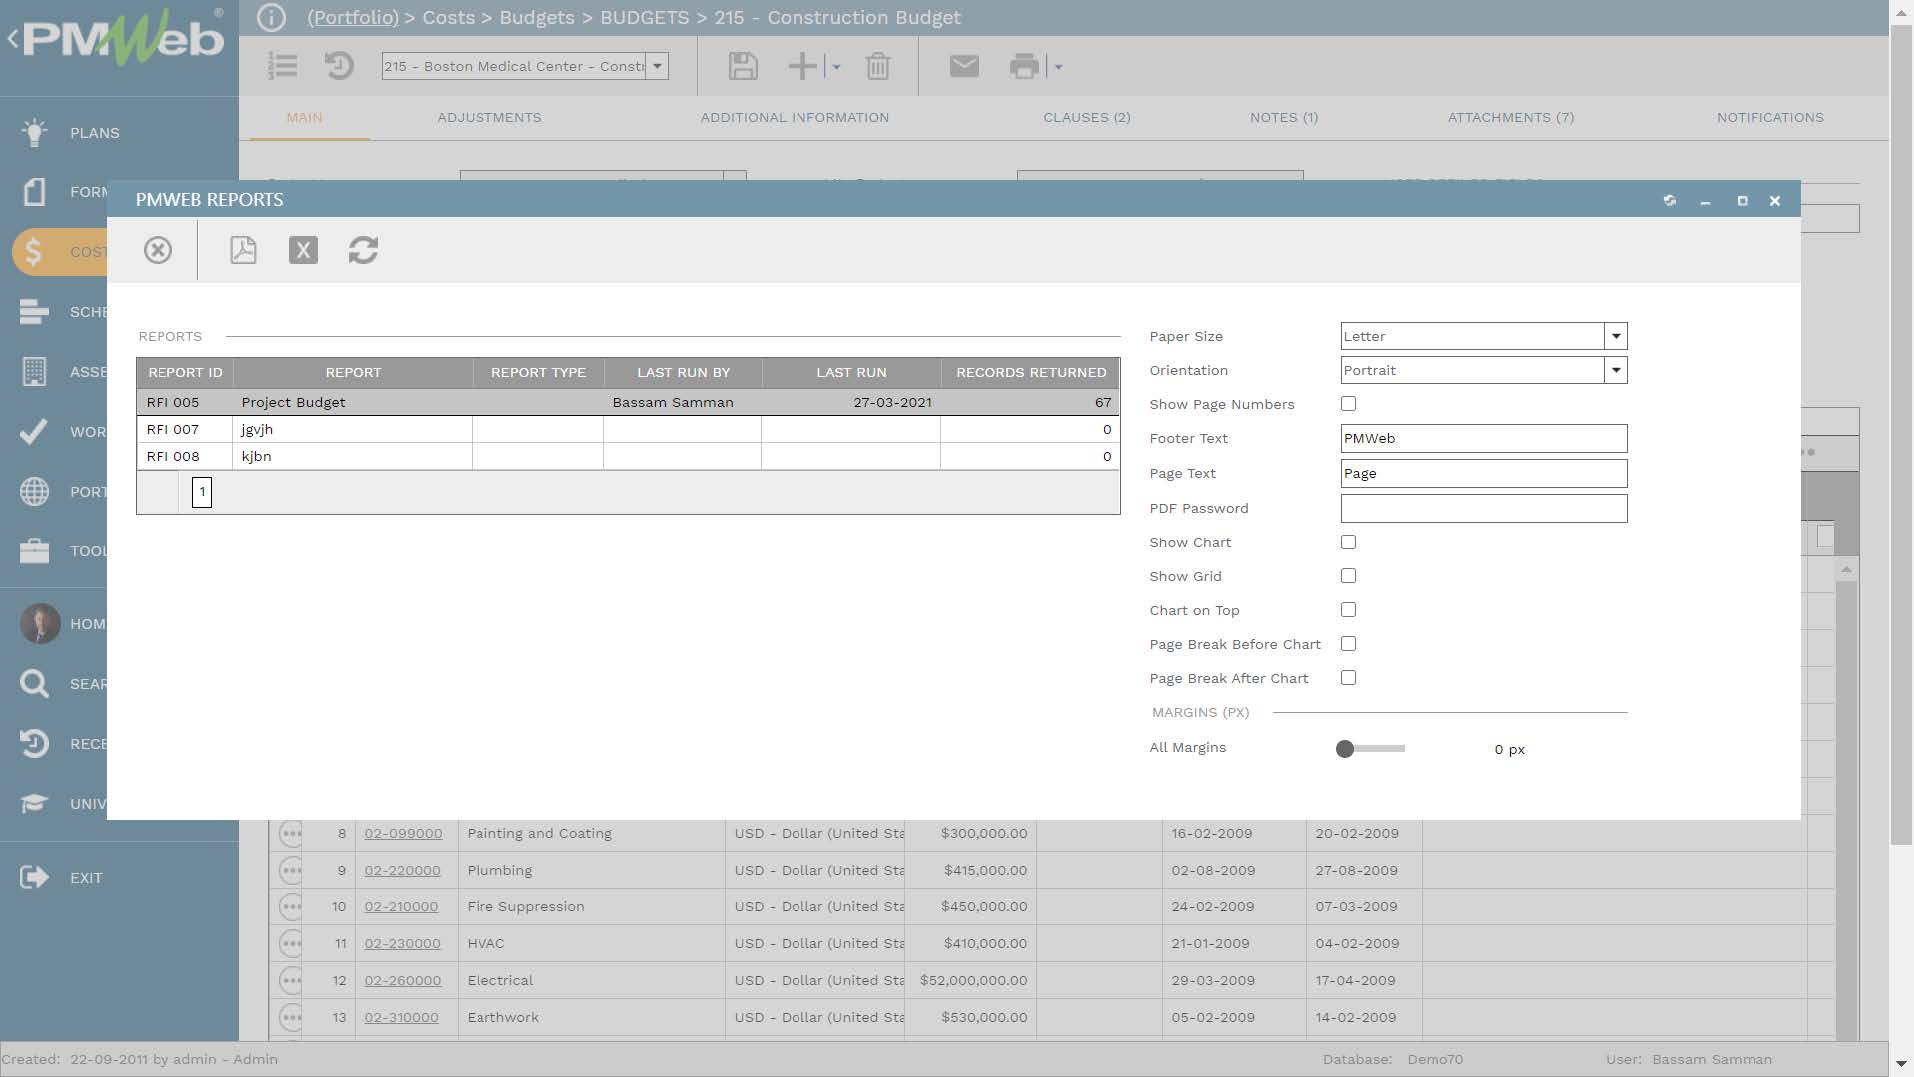
The designed report will now become available from the process it relates to. For example, if a project stakeholder wants to report on the project budget for the project that he or she has access to, then from the budget module, he/she will select the PMWeb Reports option. This will show all reports that have been designed for the budget module. The user can select the needed report and select the MS Excel option for generating the report output.
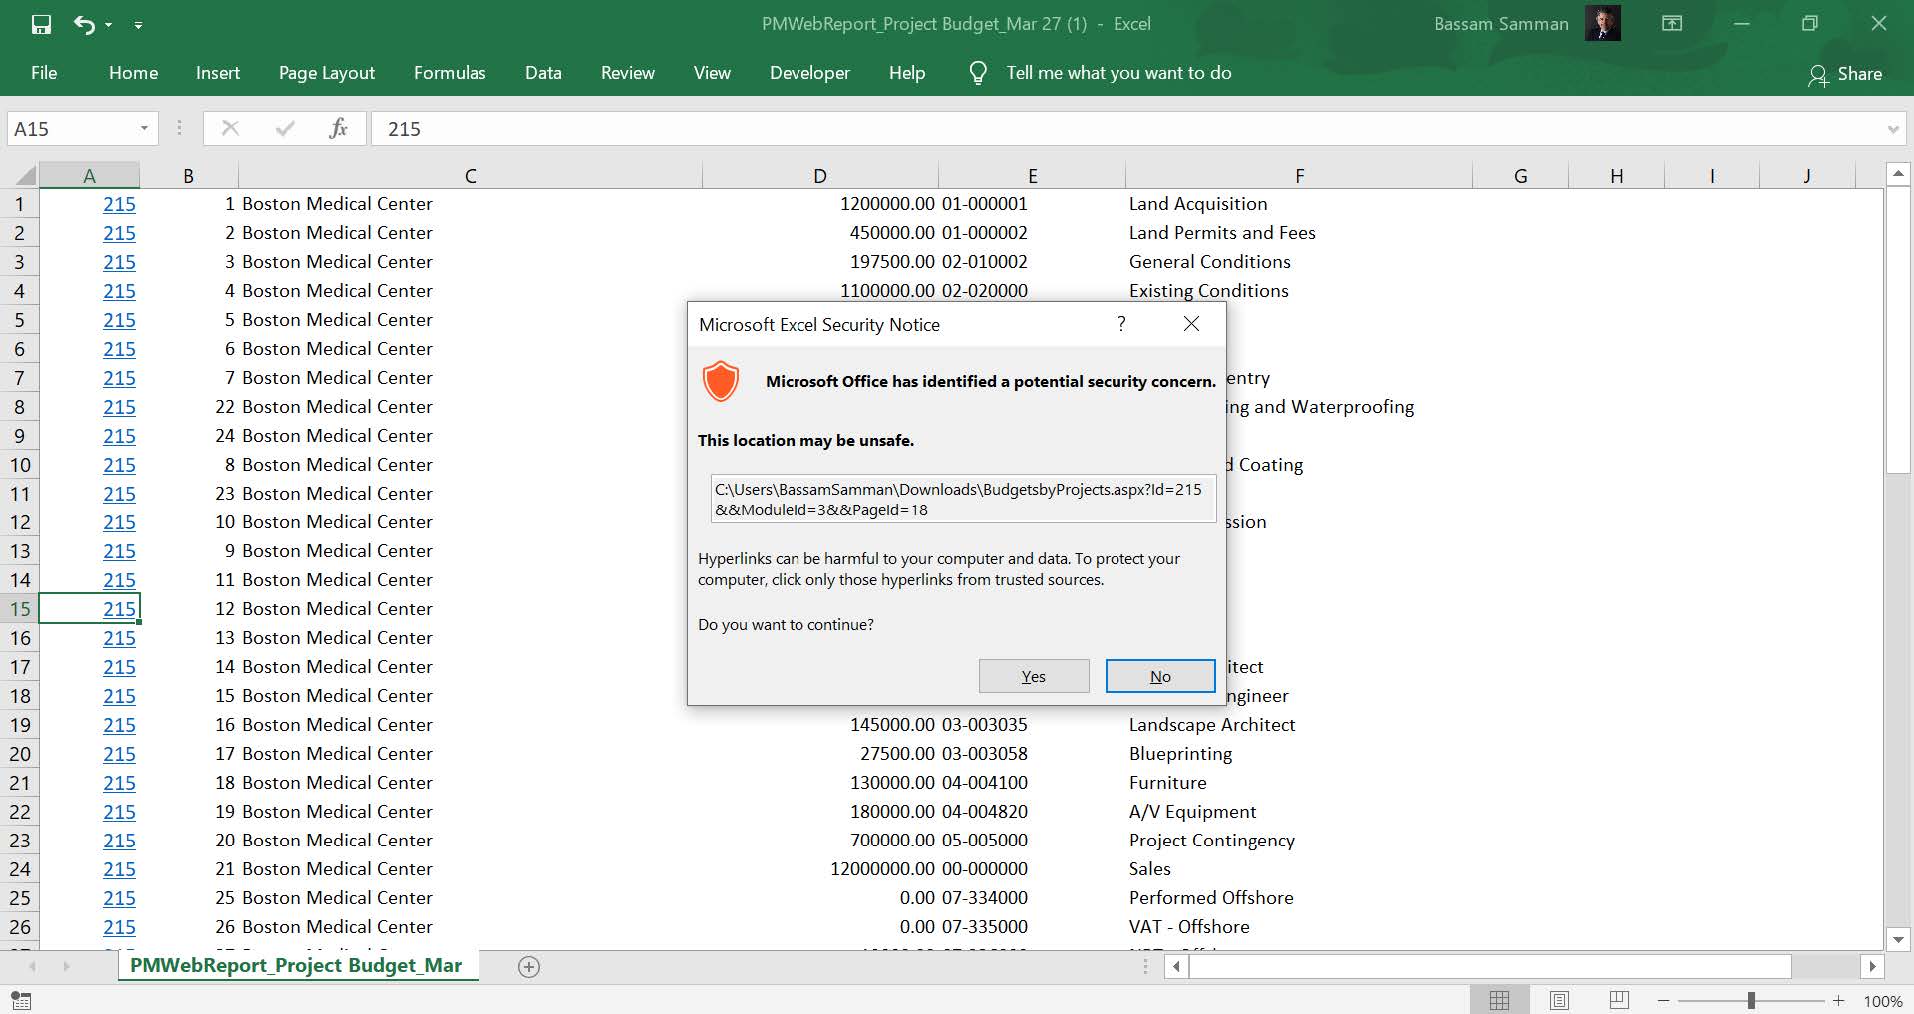
PMWeb will automatically generate the report in MS Excel file format in the same layout that it was designed in. The report will display the latest data captured in PMWeb. Nevertheless, what is very important is the URL hyperlink for the record that the data row relates will be also added. This is very important if the project stakeholder wants to trace the data source which can be done by just clicking on the link. The URL field can also be part of the MS Power BI report. It should be noted the MS Excel file sheet name will automatically pick the PMWeb data table name and the Month and date it was generated. For example “PMWebReport_Project_Budget_Mar 27”.
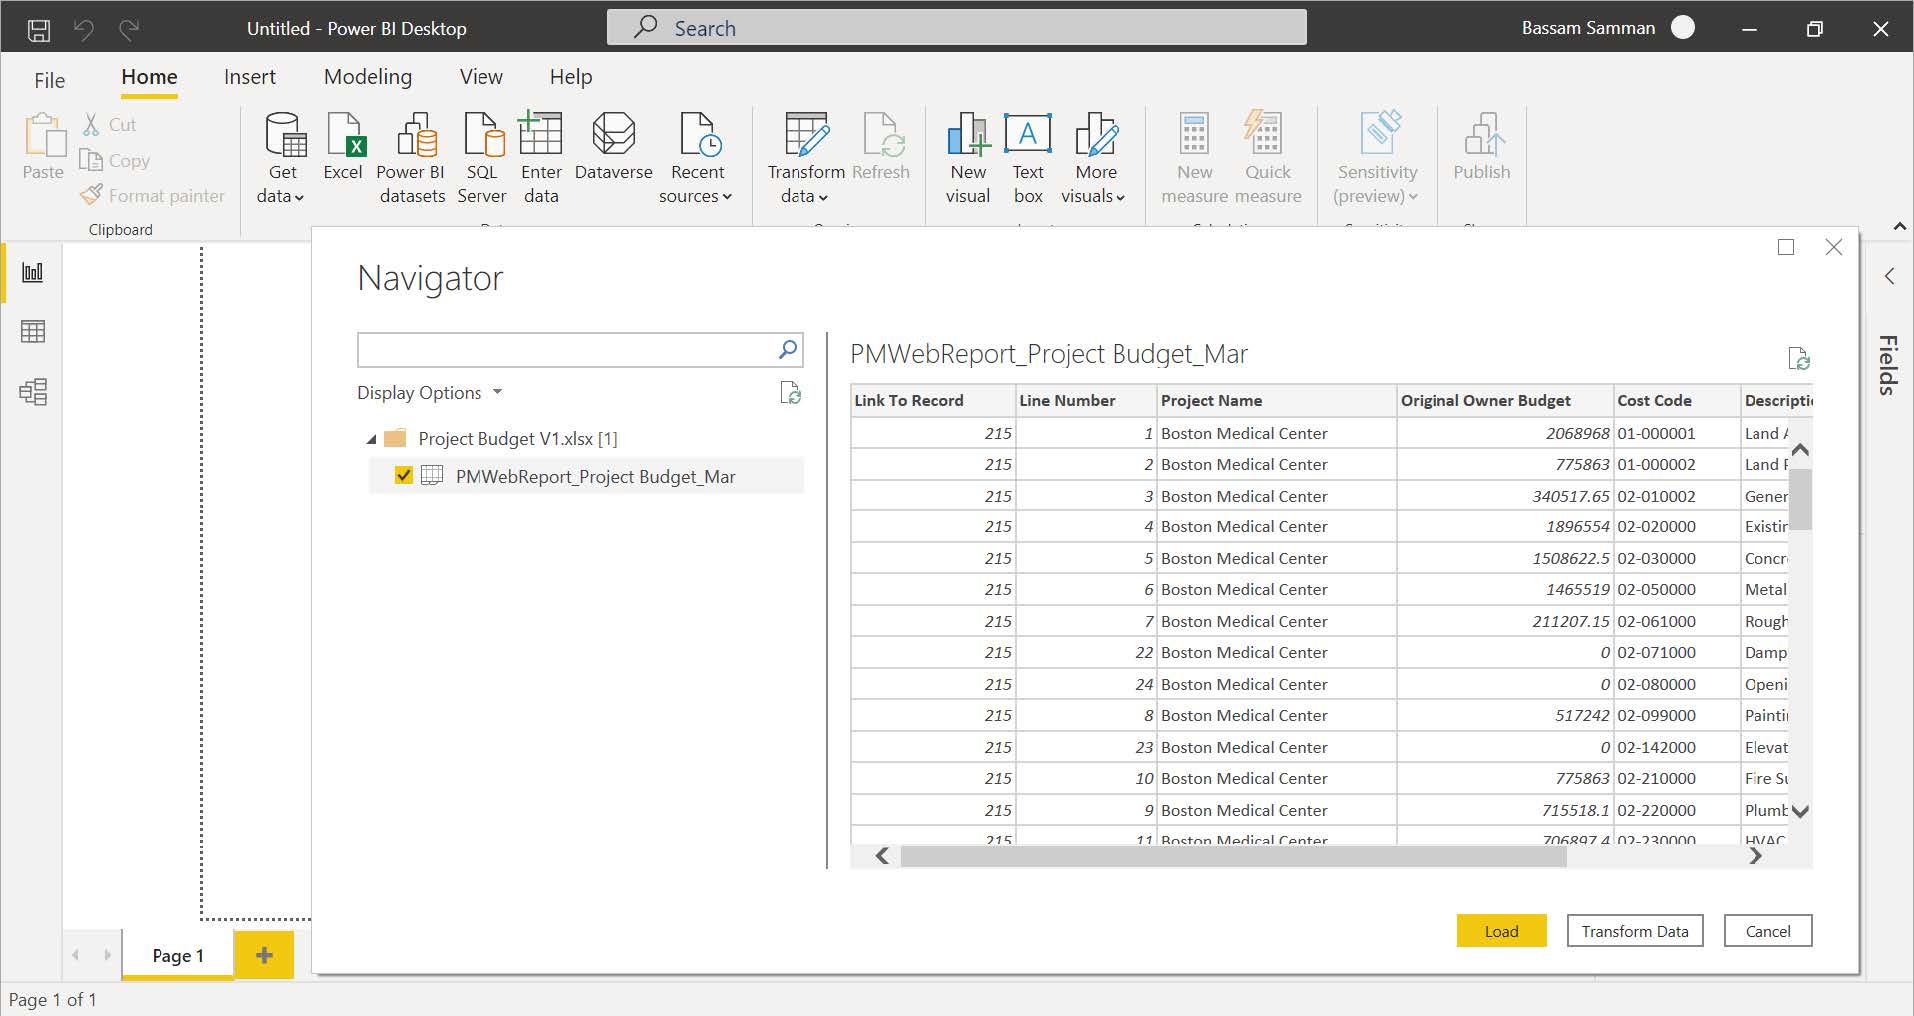
The project stakeholder can modify the MS Excel data if needed, add new fields as well as new calculated fields. The saved MS Excel file will become the file that will be used to be read by MS Power BI. Each imported MS Excel file will become an MS Power BI table that will include the data fields exported from PMWeb as well as those fields that could have been added by the project stakeholder.
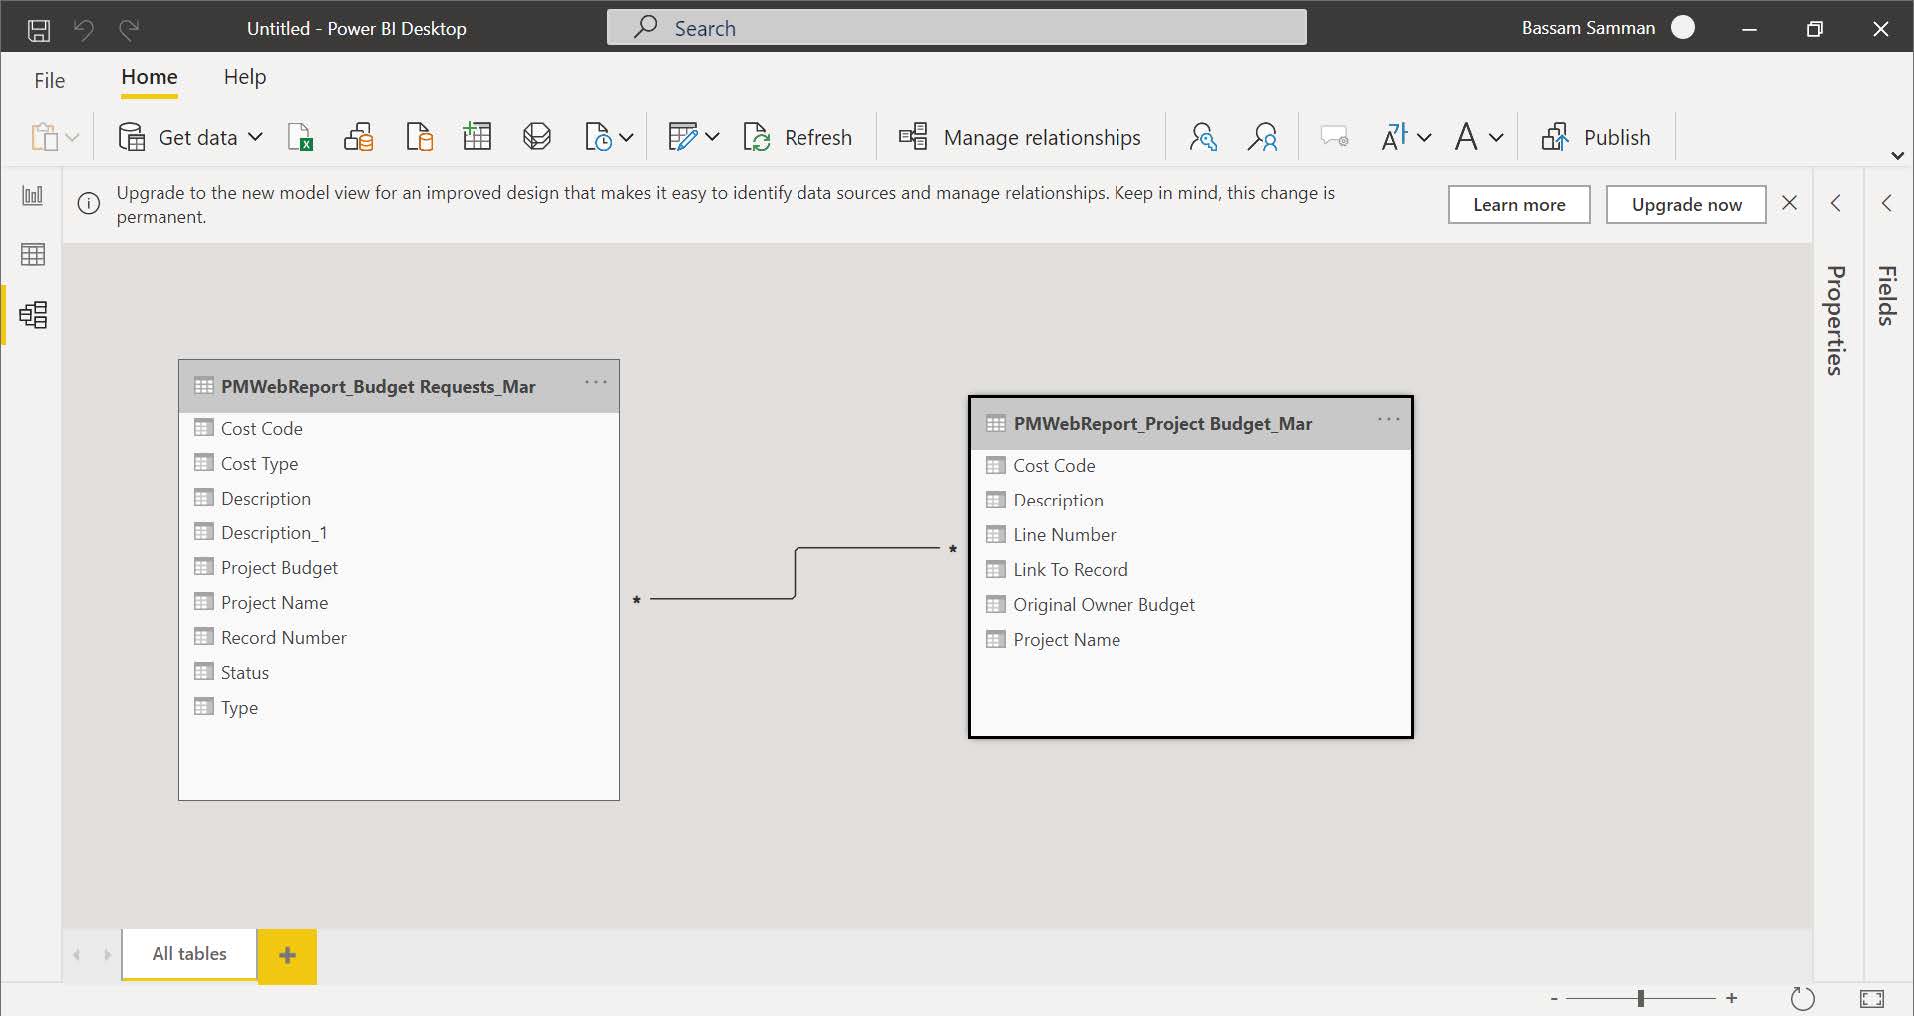
Some project stakeholders might need to associate, blend and combine the data captured from different PMWeb processes that were captured in separate MS Excel files to provide them with the needed insight. For example, a project stakeholder might have the interest to combine the data captured from the budget module with the data captured in the budget requests module which covers both budget transfers and budget adjustments.
The same steps that were used for generating and exporting the project budget data will be repeated for the budget request module. The budget request file will be imported to the same MS Power BI also following the same steps. This will enable associating the two data tables by common data fields, for example, the cost account or cost breakdown structure (CBS) fields. Other common fields could be the project name if the reported data was from more than one project. The data generation, export, import, and association will be done for all other data tables that the project stakeholder might want to include in the MS Power BI report to enable them to dice, slice, analyze and visualize in their preferred format.
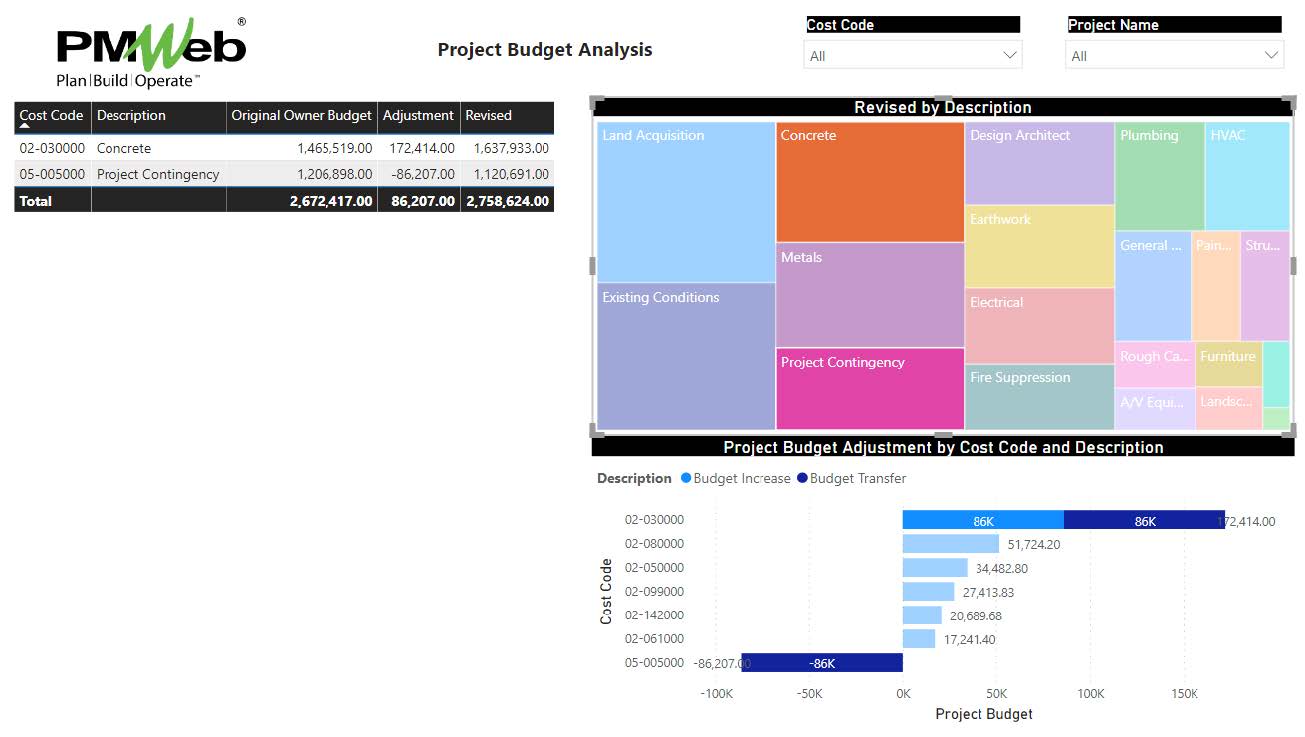
Now the project stakeholder can model and present the imported project budget and budget request data in the format that he or she desires. For example, first, a new measure will be added to add the data of the original budget and the budget adjustment value for which each is at a separate data table. Next, using MS Power BI visuals, a table will be created to display the original budget, adjustment, and revised values for each cost center. A treemap visual will be created to show the total revised budget value for each cost center and a bar chart visual will be created to show the details of budget adjustments to each cost center. The report will also include two filers, for project name and cost account number.
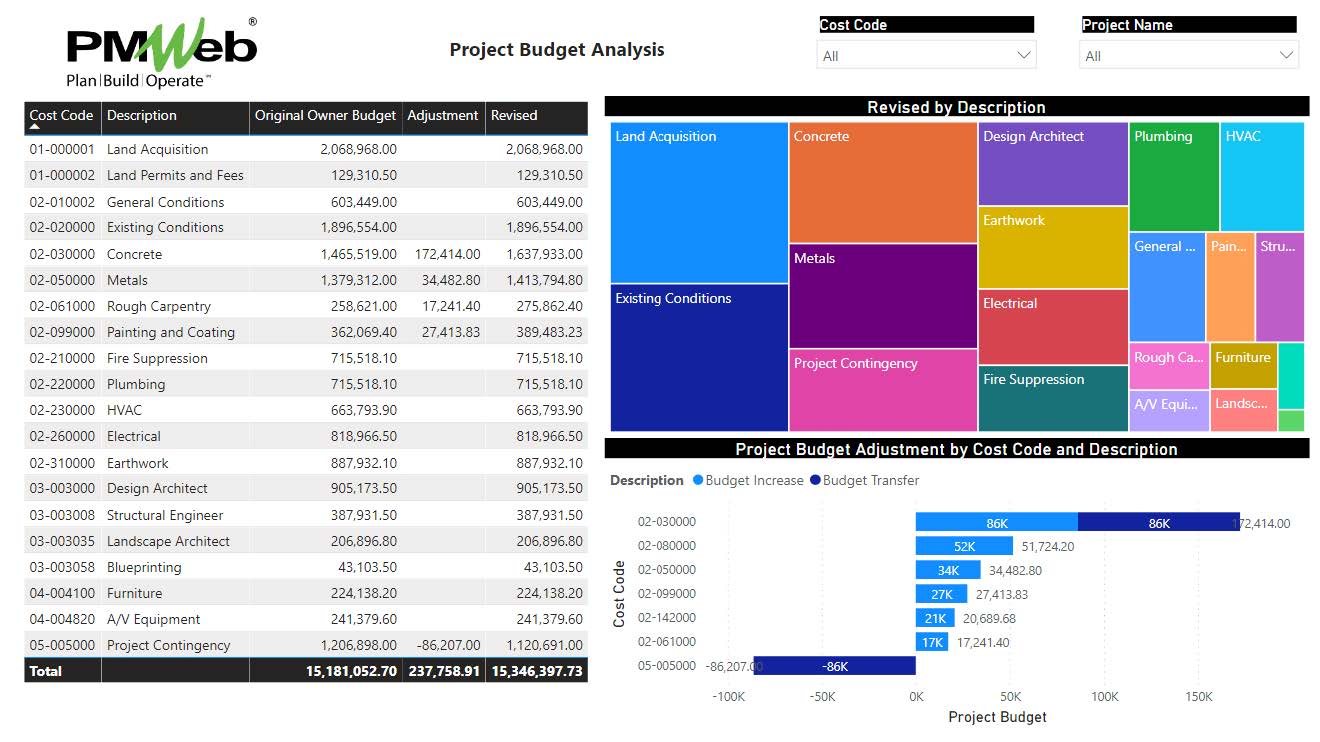
Since the report is an interactive report, selecting data from a visual will adjust the displayed in the other visuals. For example, if the cost accounts for Concrete and Contingency were selected from the treemap, the data in the table, and bar chart visuals will be automatically changed to reflect this selection.