Organizations that have projects spread across different geographical locations within the same country or even across multiple countries and continents have the interest to report their projects’ performance using maps to easily visualize the location of a project or portfolio of projects. This is more of a requirement for executives and other stakeholders who are not deeply involved in the management of the projects’ portfolios. Therefore, they should not be required to access the organization’s project management information system (PMIS) to get this information. Nevertheless, they are keen to have the trustworthy performance information that the PMIS is used to enforce.
PMWeb PMIS is one of those applications that is widely used by project-centric organizations to manage their projects portfolio from inception to operation including the phases of planning, design, tender, construction, and handover. PMWeb allows those organizations to manage the complete project management processes including but limited to scope, schedule, cost, quality, safety, human resources, communications, risks and issues, contracts procurement and administration, claims, environment, sustainability, and benefits realization, among others.
PMWeb PMIS will be used as the platform that enables having a real-time single version of the truth projects’ monitoring, evaluating, and reporting solution that is map-centric where the first level will be a summary of the regions, territories, or countries where the organization has their projects. Then stakeholders can drill down to a specific region, territory, or country where a Google or ESRI map displays the projects that the organization has within that region, territory, or country. When one of those projects is selected, the project dashboard will be displayed where it shows the exact project location on a Google or ESRI map along with the project’s performance and status details. For housing projects or projects that consist of different building blocks, another shape map can be created for the project layout can report the performance by house or building. This could also be for roads, highways, pipelines, and other linear projects where the phases or segments of the projects can be displayed.

Building the Projects Inventory
PMWeb allows the organization to capture all their projects regardless of if they were being executed, planned, completed, canceled, or on hold. For each project, PMWeb allows the organization to have all needed details to better describe the project along with the latitude and longitude values needed by GIS solutions for map reporting. In addition, it allows attaching all documents that could be related to the project.

Capturing and Reporting Project Progress Details
Although PMWeb allows capturing all processes needed to manage a project, nevertheless, we assume that the organization is mainly interested in the monthly progress report provided by the project manager. The progress report is designed using the PMWeb custom form builder to capture the progress details that matter to the organization. The form has the fields and a pre-defined list of values that all project managers must use regardless of which project is being reported. This not only ensures transparency but enforces standardization in performance reporting.

The importance of capturing progress report data and any other project management data using a PMIS like PMWeb is that it helps the organization not only in maintaining the historical data of past performance across their complete projects portfolio but enforces governance in capturing and reporting this performance data. The monthly progress form along with all supporting attachments submits through a pre-defined review and approval process thus enforcing governance, transparency, and accountability and having real-time trustworthy data to report on.

Monitoring, Evaluating, and Reporting the Projects’ Performance
The data captured in the online progress report becomes the basis for producing the progress report which can be designed in any desired format including the display of progress photos that were captured, uploaded, and stored on the PMWeb document management repository and then attached to the progress report. The progress report could also be linked to other documents in PMWeb. The report can be saved as PDF or printed.

If the project is a housing project, consists of multiple building blocks, or a linear project that has phases and segments, another performance report will be created to capture the performance details of each unit within a project. For example, the report below shows a project that has 11 building blocks. The report displays the planned and actual start dates for each block along with the current percent complete and performance scores against schedule, cost, quality, safety, and overall performance. In addition, the report details the planned and actual quantities of concrete placed on the project. The report is interactive and if the user clicks on a block, the data gets filtered to display the performance values of that block.

Those progress reports can be designed to become linked to the PMWeb enterprise dashboard which shows a Google or ESRI Map with projects displayed on the map. When the organization selects a project from the scorecard which is part of the enterprise dashboard, the project dashboard appears as the ability to drill down is a standard function in PMWeb.

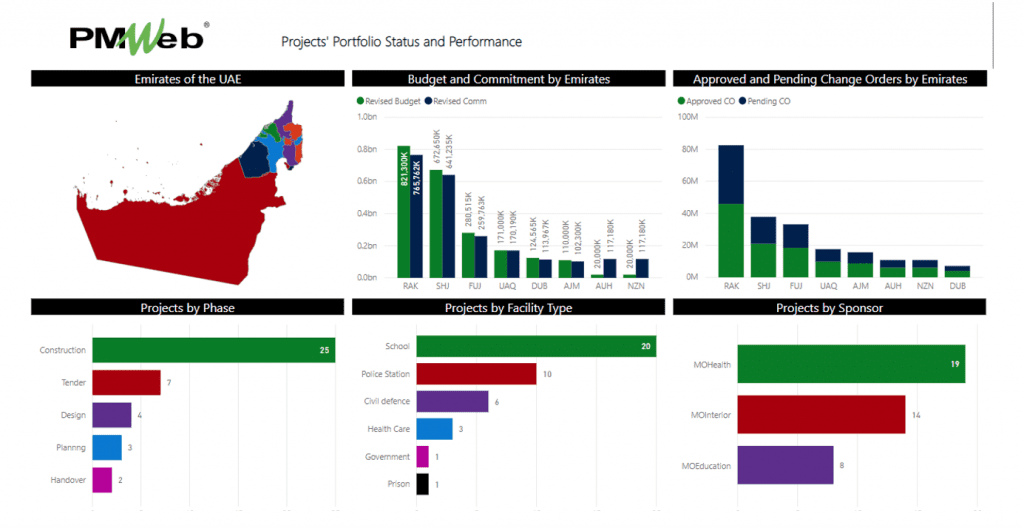
For organizations who have their projects’ portfolios spread over the country or different parts of the world, having a Google or ESRI map with all projects plotted might prove to be overcrowded and hard to read. Therefore, it is recommended to have a map that only shows a summary of territories, regions, or countries where the organization’s projects exist. For example, assume that the project owner has different capital projects across the United Arab Emirates. A shape file will be added to show the seven emirates of the UAE for which each will be colored differently. The shape file will be an interactive chart where if the reader clicks on any of the seven emirates, the information displayed in the five other visuals adjust to reflect the values relevant to that emirate.