There is a growing trend in using MS Power BI to create interactive reports and dashboards for monitoring, evaluating, and reporting the performance of capital construction projects. Nevertheless, most of those reports and dashboards continue to use MS Excel as their data source for the displayed information. Using MS Excel as a data source violates the much-needed best practices of transparency, accountability, and governance in managing capital construction projects. In addition, MS Excel comes with its own issues of no error control, lack of a verified, reliable, repetitive way to collect data from multiple sources, serious issues in dealing with large data volume, difficult for different team members to collaborate, and time-consuming processes among others.
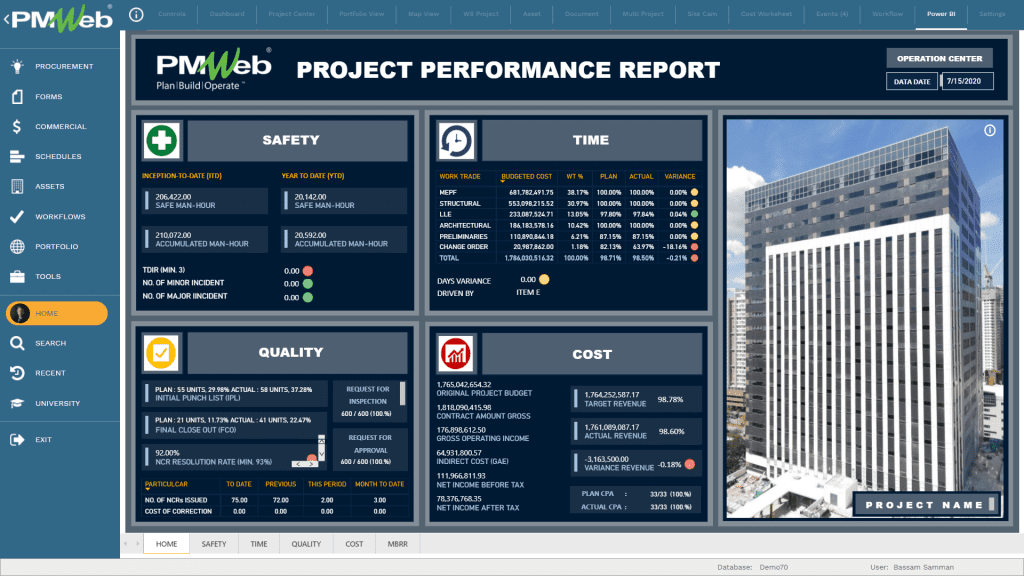
One of the recent MS Power BI dashboards that caught my attention was the project dashboard created by Ryan De La Peña Cogonon (https://www.linkedin.com/in/ryan-de-la-pe%C3%B1a-cogonon-719bb3179/). The dashboard home page provides a quick preview of the project’s four goals, having a safe project, delivering the required quality standard, completing the project as planned, and within the approved budget. The dashboard allows the reader to drill down and review the performance details of each one of those goals and their associated objectives. The full details of the dashboard are available on this link https://www.linkedin.com/feed/update/urn:li:activity:6722063560765255681/

Nevertheless, the challenge for getting the intended benefits of this dashboard is the trustworthiness, traceability, and auditability of the displayed information which tends to be quite extensive. MS Excel was the data source for the dashboard which I expect that it has many data sheets with a large volume of data in each sheet. Of course, there is also the chance that multiple MS Excel files were also used as the type of data captured indicates that the information is coming from different sources. In addition, the dashboard is capturing information for different periods which indicates that past periods’ performance data is also captured on the same Excel file. On top of all of this, there is the issue of maintaining the same MS Excel files for all other projects managed by the organization.
In other words, not only do we have the challenges of a lack of transparency, accountability, and governance on the reported information but we also have the high-occurrence chances and impact for the risks of no error control, lack of a verified, reliable, repetitive way to collect data from multiple sources, serious issues in dealing with large data volume, difficulty for different team members to collaborate, and time-consuming processes among others.
Using a Project Management Information System (PMIS) like PMWeb will eliminate those challenges and risks by enforcing a formal process for capturing all needed project management information that is fully documented, traceable, and audited. This will be achieved by having Input forms, either available by default or created using the PMWeb form builder, attached and linked supportive documents, records, and MS Outlook emails and a workflow to formalize the submit, review and approve tasks for each project management process.

As mentioned above, the dashboard has detailed pages for each project goal for which the information will be summarized on the cover page. The first one of those pages provides details of the project for which it will be captured in the PMWeb project module’s main page, a list of project stakeholders that will be also captured in the project module contacts page, and a project picture that will be attached to the project module. There is the option to replace this static picture with a live feed from a time-lapse construction camera by providing the camera IP address. The page also includes details of milestone dates that will be captured in the PMWeb scheduling module for each schedule update. The schedule data can be either created in PMWeb or imported from Primavera P6 or MS Project.

The next page is the Safety page where it mainly captures details of safety incidents and resource manhours deployed on the project site. This will require using two of PMWeb default modules being the Safety Incident and Daily Reports as well as an Issue form which will be created using PMWeb form builder. Of course, there is also the option of improving the reported data by creating the processes for Covid-19 incidents, Safety Violations, and Permits to Work as well as using the PMWeb meeting minutes module for Toolbox meetings.

The Quality page includes details on Requests for Inspection (RFI) or Work Inspection Requests (WIR), Requests for Approvals (RFA), Non-Compliance Reports (NCR), and completed works. The PMWeb form builder will be used to create the Work Inspection Requests (WIR), Non-Compliance Reports (NCR), and other processes. The completed works will be captured from the project schedule. Of course, the report can be further improved by using PMWeb default modules for technical submittals review and approvals, Request for Information (RFI), and other related processes.

The next dashboard page is the Schedule or Time page. The page includes details on labor resources deployed on the project which will be extracted from PMWeb daily report module as well as project schedule data which will be extracted from the PMWeb scheduling module or from directly from the project schedule. The report also includes earned value measures for which data will be captured from PMWeb contract module progress invoices for earned value (EV) which the actual cost (AC) will be captured using the commitment progress invoice module. The planned value (PV) will be captured from the PMWeb budget module.

The dashboard has a number of measures that can be easily created in MS Power BI as long as the data sources are available in the right format. In addition, more pages can be also created to capture other important project information that relates to change management, claims, sustainability, communications among others. In addition, PMWeb form builder can be used to create a form to capture the progress narrative that the project manager is required to provide.
The great value that MS Power BI brings to the capital construction project delivery is that the project’s information which was not possible for many stakeholders to visualize in an easy and readable format is now over. Nevertheless, those stakeholders want accessibility to be for real-time, trustworthy, traceable, and auditable information. This can be only achieved when a Project Management Information System (PMIS) is deployed to manage and capture the massive data of everyday project management processes across the organization’s complete project portfolio.


