Capital project owners need to have an objective approach for monitoring, evaluating, and reporting their projects’ portfolio performance. Those project owners want to monitor, assess and report each project’s performance trend and benchmark their performance with good achievement metrics. Those project owners want this performance information to be available for them anytime, anywhere.
Similar to any other type of business, an organization needs to identify the key performance indicators (KPI) that can be measured to report if their projects’ performance is acceptable or not. There are several common key performance indicators for capital projects related to project cost, schedule, quality, safety, and risk. For each of those indicators, the organization needs to determine the thresholds for acceptable and non-acceptable performance.
Using a Project Management Information System (PMIS) like PMWeb, the organization can ensure that the data needed to calculate those key performance indicators is robust, reliable, relevant, auditable, appropriate, attributable, traceable, transparent trustworthy. This will be made possible by automating the needed project management processes to ensure that the right data is captured by the right team member, in the correct format, and the right sequence.
Deciding on the KPIs to Monitor and Evaluate and their Importance
Assuming that the full score for a successful project’s performance is 100%, the organization needs to decide the share of each project’s success measure out of this 100%. For example, finishing a project on time could weigh 30% out of the total 100%, whereas the lost time injury frequency could have only 10% weight. Sometimes, there could be a need for more than one key performance indicator to assess the performance of one of the project’s different objectives. For example, there could be a need for two key performance indicators for evaluating the project’s cost performance. The first will be to monitor and evaluate the project’s budget performance, while the second will be to monitor and assess the project’s completion cost predictability.

Lost time injury frequency rates (LTIFR)
LTIFR is a proxy measurement for safety performance. A lost-time injury results in a fatality, permanent disability, or time lost from work. It could be as little as one day or few hours. LTIFR refers to the number of lost-time injuries within each month, relative to the total number of hours worked in that period.
LTIFR calculations measure the number of lost-time injuries per million hours worked during a month. The number of lost-time injuries per hour worked is always minimal. To make it easy to interpret, a multiplier of one million is used, and LTIFR is reported as the number of lost-time injuries per million hours worked.
To convert the LTFIR into a measure of 100%, the LTFIR calculated value needs to be divided by the building construction industry rate for the country where the project is executed. For example, Australian and New Zealand Standard Industrial Classification (ANZSIC) set the LTFIR for the building construction at 5.6. The organization can then assess the favorable performance for LTFIR when it is less than 5.6 and unfavorable performance of it is more than 5.6.

PMWeb safety incident module will capture all project accidents, including the number of lost time injuries in a specific month. The total hours worked in a month will be either captured from PMWeb daily report module or provided by the organization’s attendance system.
Budget Performance Index (BPI)
The budget performance index is the ratio of the full year actual cost incurred through contracts’ progress and other miscellaneous invoices against the total allocated project budget for the same fiscal year. Those two values are earned value management measures of Earned Value (EV) and Planned Value (PV) for lump-sum contracts and from a project owner perspective. Accordingly, the budget performance index will be identical to the schedule performance index (SPI).
This key performance indicator measures the project management team’s ability to meet the forecasted expenditures for the fiscal year. For most organizations, failing to spend the approved budget for the fiscal year means that other organization’s projects were deprived of using those funds which were blocked for the other project.

The allocated budget for the fiscal year will be captured from the PMWeb budget module. In contrast, the same fiscal year’s actual cost will be charged from PMWeb commitments progress invoices and miscellaneous invoices modules. PMWeb also allows capturing actual price from the timesheet module in case those expenses are needed to be part of the KPI.
Cost Predictability Index
The cost predictability is the ratio of the estimated project’s forecast at completion versus the original approved budget at completion. The estimated project’s forecast at completion includes the actual cost to date plus all approved and pending change orders (EAC). For lump-sum contracts and from a project owner perspective, the original approved budget already includes the awarded contracts value plus usually a 10% provision for contingency and scope creep (BAC). This key performance indicator measures the project management team to maintain the estimated project cost at completion to what was initially approved and budgeted for. Suppose a project’s actual cost exceeds the approved budget. In that case, this is an indication that the project has not achieved the target benefit or value for which this project was initially selected for. For private

The original project budget will be captured from the PMWeb budget module. In contrast, the same fiscal year’s actual cost will be captured from PMWeb commitments progress invoices and miscellaneous invoices modules. PMWeb commitment module will be used to capture the balance cost for each awarded contract. The PMWeb change order module will also be used to capture the cost of approved change orders, while the PMWeb potential change order module will be used to capture the cost of pending change orders. The organization might also consider including the cost of disputed change orders, which are also captured by PMWeb potential change order module.
Project Completion Date
Project completion date KPI is the ratio of the current project delay duration (measured from total float) to the elapsed project’s time. Usually, project owners allow a 10% schedule buffer on their contractual project’s completion date. In other words, for a project that has a planned duration of 730 days, the project owner will usually allow 73 days buffer to the actual need date. Of course, this could vary from one organization to another and even from one project to another.

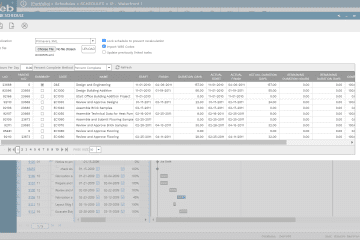
This KPI will be calculated using the PMWeb scheduling module, which can be either used to create the project’s baseline schedule and follow on updates or import this schedule data from Oracle Primavera P6 or MS Project.
Pending NCRs
The total number of pending non-compliance reports KPI will indicate how successfully the project team has all reported non-compliances resolved by the contractor or other project stakeholders. PMWeb, a custom form builder, will be used to create an NCR template to capture the details and status of all issued NCRs. Non-compliance reports are usually related to quality, but they can also include safety NCRs.

Pending Issues
The KPI for the total number of High Priority Issues that are pending resolution will indicate how successful the project team is in resolving all issues that could significantly impact the project’s completion date. PMWeb, a custom form builder, will be used to create the Issue template to capture the details and status of all escalated issues.

Project Performance Index (PPI)
As detailed earlier, each key performance indicator (KPI) has a weight for which the sum of all KPIs’ weight will be 100%. This will help calculate the weighted Project Performance Index (PPI) for each project at the end of each period in an objective format. It should be noted that for some projects, the weight distribution for the six key performance indicators could vary depending on the importance of those project’s objectives to each project.

Reporting Projects Performance
Those KPIs will provide the organization with a single real-time version of the truth monitoring, evaluation, and reporting for each project performance status across the organization’s projects’ portfolio. Using a PMIS like PMWeb, the report viewer could drill down to the data source used to calculate each KPI. For example, the user can drill down to the issues register to get the needed details on the pending reported problems. The same approach will be available for all other KPIs.

The key performance indicator (KPI) values for each project can be consolidated in a single dashboard to provide the organization’s executives with an overall status of their projects’ portfolio performance. Graphical charts can be added to benchmark the performance of projects to each other.

The report viewer can also monitor, evaluate, and visualize the past periods’ performance trends for each KPI. The project best views this trend report, although comparing a specific project’s performance trend with other projects is possible. The trend report can provide the report viewer with the ability to forecast the expected performance trend for the remaining periods.