For engineering consultants, general contractors, EPC contractors, design-build contractors, subcontractors, and other entities whose project profitability depends on the efficiency of their planned resources, labor, and non-labor, in delivering the project’s scope of work, need information to enable them to monitor, evaluate and report on any variances, the reasons that have caused those variances, and the actual performance efficiency achieved to date. This information enables them to implement the needed corrective measures to improve the efficiency of resources for delivering the remaining scope of work to avoid resource overrun which results in project loss.
The Earned Value Method (EVM) is one of the proven project management techniques used for monitoring, evaluating, and reporting the performance of deployed resources as well as providing a trusted technique to forecast the expected resource hours at completion. The concept of EVM is based on managing four variables, the project-approved resource quantities (BAC), the quantities of the planned resources for the scheduled scope of work (BQWS) also known as Planned Quantity (PQ), the actual resource quantities for the performed scope of work to date (AQWP) also known as Approved Quantity (AQ) and the budget quantities of resources for the performed scope of work to date (BQWP) also known as Earned Value (EV)

Determining the Budget at Completion and Planned Resources Quantities for the Scheduled Scope of Work (BQWS)
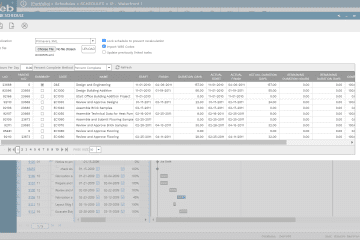
Usually, Oracle Primavera P6 or MS Project helps to determine and plan the resource requirements during the project’s execution period. Each project schedule activity will be loaded with the labor and non-labor resources needed to deliver the scope of work associated with the activity. The total resource hours per activity is the Budget at Completion (BAC) for that specific activity for which, when all project schedule activities are summed, the project’s Budget at Completion (BAC) calculates. The project schedule’s resource requirement levels to the extent possible to avoid resource overload. Upon completion of this analysis, Oracle Primavera P6 or MS Project automatically generates the Planned Resources Quantities for Scheduled Scope of Work (BQWS) at the end of each period. The resources assignment report displayed below is an example of this output report.

Budget Quantities of Resources for Performed Scope of Work to Date (BQWP)
The Oracle Primavera P6 or MS Project schedule needs to be updated on a weekly basis to provide the status of all activities that have started, progresses, or been completed. This enables determining the physical percent completion of those activities. By multiplying the approved percent complete by the resources Budget at Completion (BAC) value for each activity, Oracle Primavera P6 or MS Project calculates the Budget Quantities of Resources for Performed Scope of Work to Date (BQWP) value.
This enables the planning and scheduling tool to calculate the first earned value metric which is the Schedule Variance (SV) which is the difference between the Budget Quantities of Resources for Performed Scope of Work to Date (BQWP) and the Planned Resources Quantities for Scheduled Scope of Work (BQWS). A negative Schedule Variance (SV) value indicates a delay in spending the planned resources which is not favorable as this might also indicate a delay in the project schedule. In addition, the Schedule Performance Index (SPI) which reflects the efficiency in spending the planned resources as of today will be also calculated by dividing the Budget Quantities of Resources for Performed Scope of Work to Date (BQWP) over the Planned Resources Quantities for Scheduled Scope of Work (BQWS). A Schedule Performance Index (SPI) value that is higher than one is considered favorable.
Actual Resource Quantities for Performed Scope of Work to Date (AQWP)
To ensure that the actual resource hours for the progressed activities are trustworthy, auditable, and traceable, the actual resource hours need to be captured directly from the data source which could be a daily report for on-site activities or timesheets for office-related activities. Using a project management information system (PMIS) like PMWeb where those two modules are available by default, can be achieved. But before achieving this, some steps need to be completed. The first is to populate PMWeb Labor and Equipment Resource modules with the resources that are used in the project schedule. Since those resources’ designation and types will be the same for all projects managed by the organization, this task only needs to be performed once.

The second requirement is to import the Oracle Primavera Project P6 or MS Project schedule activities into PMWeb using the default project schedule function. This enables having the detailed project schedule activities list used in PMWeb Daily Report and Timesheets modules.

The above ensures that PMWeb and the planning and scheduling software have the same project name, WBS
levels, project schedule activities, and labor and equipment resource designations. The PMWeb Daily Report module helps the different project team members report the actual performance of work completed on-site. The timesheet tab in the daily report records the actual resource, labor, and equipment, hours spent daily. Resource hours will capture the start and finish times. In addition, PMWeb allows assigning if those resource hours were regular working hours, overtime, weekend, or holiday charged hours. In addition, a cost breakdown structure can be assigned for each resource entry. Nevertheless, the most important of all is that the project team members need to assign the project schedule activities that those resource hours were spent against.

If the actual resource hours are for office activities, the PMWeb Timesheet module will be used. On a weekly basis, the timesheet, which could be for a single resource or for all resources that are part of the project team, reports the actual resource hours spent daily. Each resource line entry also has the relevant project schedule activity assigned to it. A workflow will be assigned to the submission, review, and approval of the reported actual resource hours.

Using a business intelligence reporting (BI) reporting tool like MS Power BI, for each project in the planning and scheduling software, the list of project schedule activities, resources assigned to each activity, and the relevant Budget at Completion (BAC), Planned Resources Quantities for Scheduled Scope of Work (BQWS), Budget Quantities of Resources for Performed Scope of Work to Date (BQWP), Schedule Variance (SV) and Schedule Performance Index (SPI) values
import into the BI reporting tool. In addition, and for each project in PMWeb, the list of activities and resources assigned to each activity along with Actual Resource Quantities for Performed Scope of Work to Date (AQWP) captured in daily reports and timesheets imports to the same file in the BI reporting tool. Since the two imported tables share the same project name, activity number, and resource names, the BI reporting tool automatically creates the integration between the two tables even if they are coming from two different data sources.

Using the same BI reporting tool, formulas will be created to calculate the additional earned value management metrics. Those will include the quantity variance (QV) which is the variance between BQWP and the AQWP. A negative value indicates that the actual hours spent for completing the relevant project schedule activity exceeds what was planned for which is not favorable. Another related metric is the Quantity Performance Index (QPI) which reflects the efficiency in using the project’s resources which will be calculated by dividing the BQWP and the AQWP. A Quantity Performance Index (QPI) value that is higher than one is considered favorable.
In addition, the BI reporting tool calculates the remaining earned value metrics including the Estimate to Complete (ETC) which equals (BAC – BQWP) which could be adjusted depending on the actual performance for the elapsed periods. The adjustment will be captured in a field called Performance Factor (PF) which can be based on the average QPI performance value for the last three periods, a combination of SPI and QPI, or any other factor that can reflect the performance trend for the remaining project period. The PF can be specific to an activity, group of activities, or remaining project activities. The Estimate to Complete (ETC), which equals (BAC – BQWP), will be adjusted by the Performance Factor (PF) to calculate the adjusted ETC. The Estimate at Completion (EAC) equals AQWP + ETC Adjusted. To Complete Quantity Performance Index (TQPI) equals (BAC – BQWP) / (EAC – AQWP). Variance at Completion (VAC) equals BAC – EAC.
The report displayed below is an example of a report that displays the earned value metrics detailed above for each project schedule activity. The data can be reported by resource, WBS level, or any other field used in the report. The report provides a summary of the earned value metrics for the displayed activities which could vary depending on the selected activities and resources. In brief, the report can be designed in the desired form and format to meet the reporting requirements of those who need to analyze, monitor, evaluate, and report the resource’s performance efficiency on the project, a program of the projects’ portfolio managed by the organization.