The delivery of capital construction projects involves different types of entities that usually depend on the selected project delivery model. Those could include for example design-bid-build (DBB), design-build (DB), build-operate-transfer (BOT), public-private-partnership (PPP) and others. Those entities could include the project owner, project investors, project funders, project management consultant, design consultant, supervision consultant, general contractors, subcontractors, suppliers, and others.
Similar to any other type of business, stakeholders at those entities need to have at all times a real-time single version of the truth dashboards to monitor, evaluate and report the performance of their projects and the different aspects that need to be managed on those projects. They also need to be sure that what is being reported is based on trustworthy, traceable, and auditable data. Of course, the level of detail, format, and layout that each entity wants do differ depending on the stakeholders reporting requirements.
Nevertheless, regardless of what is being reported on, the first rule for ensuring a single version of the truth reporting is that all projects’ data should be available in a single data source or at least consolidated in a single data warehouse. In addition, ensuring real-time reporting means that all projects’ data need to be captured using pre-defined digitally-enabled business processes that will ensure the trustworthiness, traceability, and audibility of shared data.
To achieve this, Project Management Information Systems (PMIS) like PMWeb, Planning and Scheduling tools like Primavera P6, Monte Carlo Simulation tools like Safran, and other applications are used to digitally enable the delivery of capital construction projects. This will allow capturing the projects’ everyday data in a transparent and accountable format. This will be the data that relates to projects’ schedule, cost, quality, health and safety, sustainability, procurement, risk, and other project management aspects.
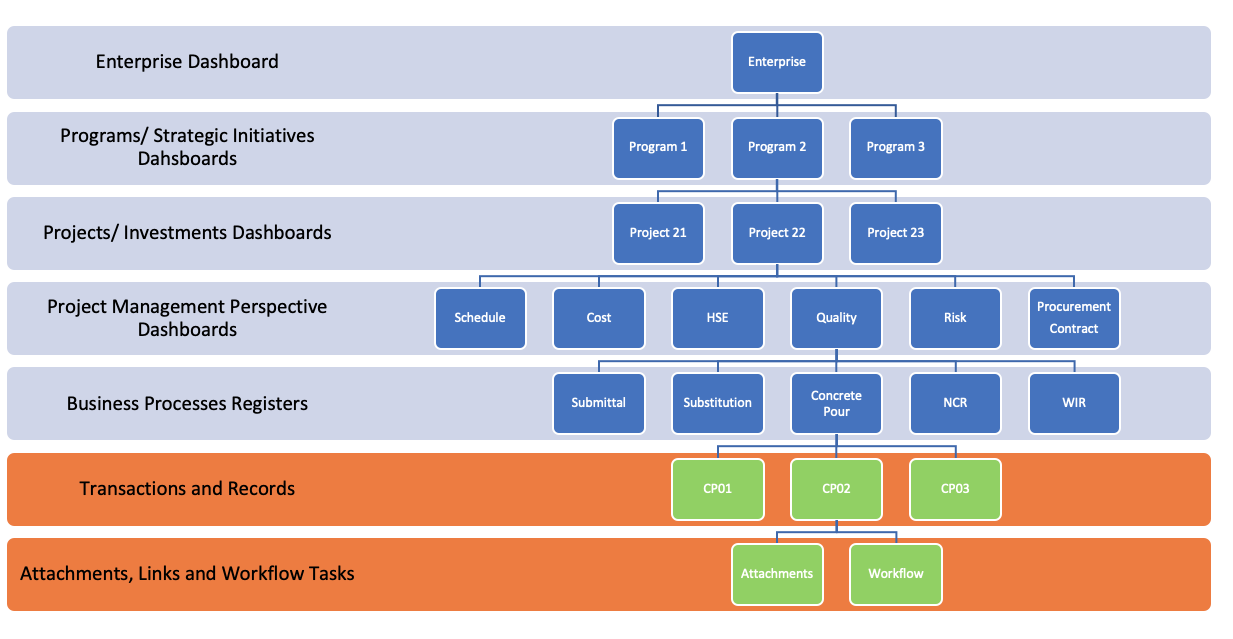
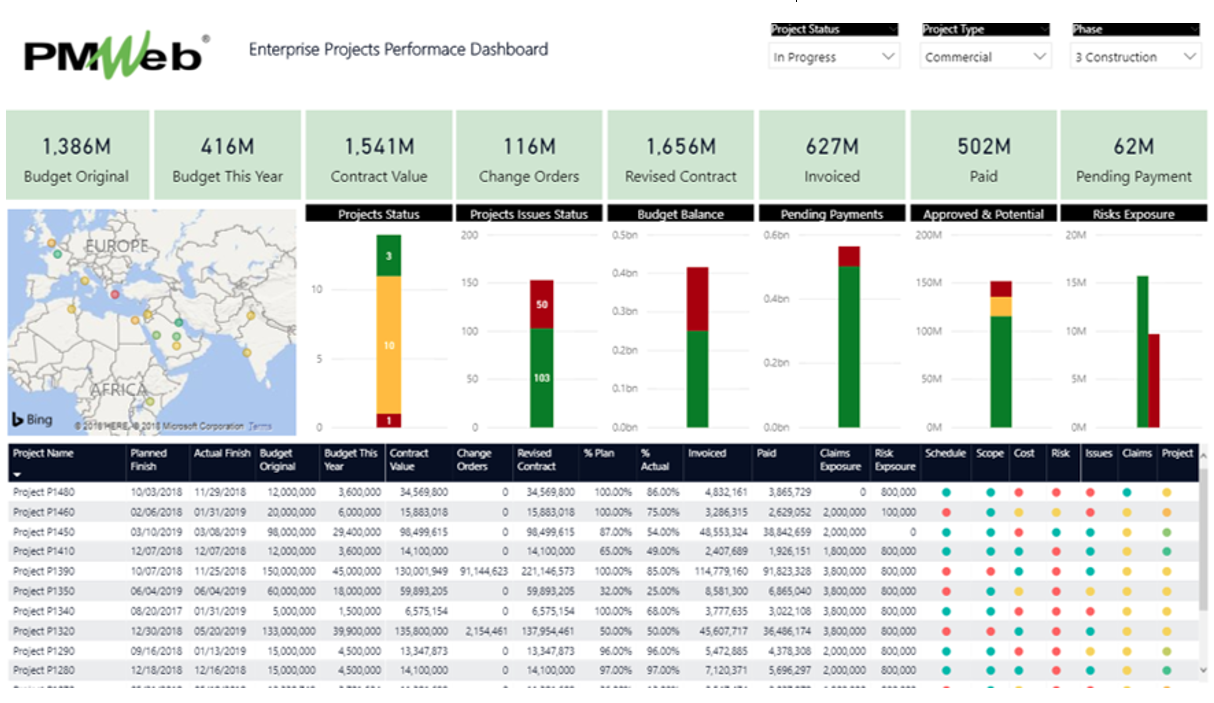
To start with, there should be an enterprise or portfolio dashboard that provides an overall performance status of all programs and projects that an organization might be involved with. Key performance indicators (KPIs) that relate to schedule, cost, quality, health and safety, sustainability, risk, and other project management areas will be reported on. For organizations that have projects spread at different locations either within the same country or different countries, the enterprise or portfolio dashboard would usually include a map showing the location of those projects and for which they will have an indicator of their overall performance status.
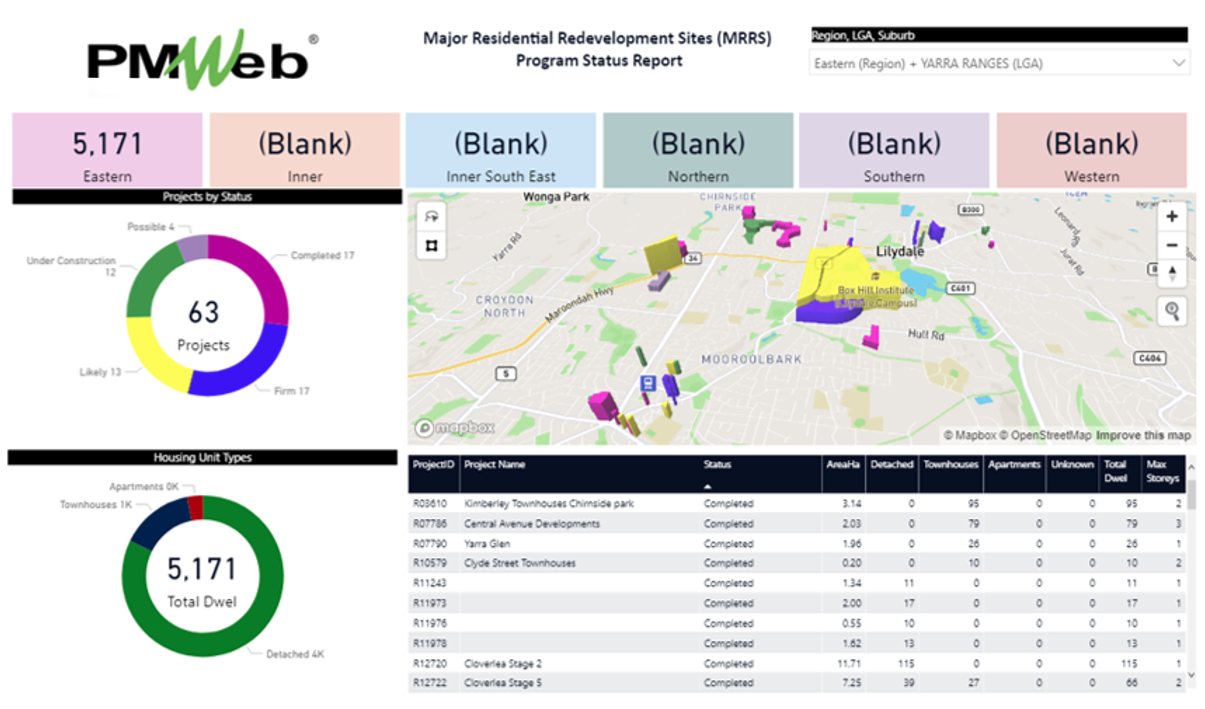
The second level of reporting will be the program level where the reporting requirement will be specific to the projects that are part of a specific program. Those programs could be used to map the entity’s strategic initiatives which should not be mixed with the project attributes like type, location, owner, status, and other types of categories that are no more than fields that can be used to filter and select the projects to be reported on. Similar to the enterprise or portfolio dashboard, the program dashboards would usually include a map showing the boundaries or locations of those projects.
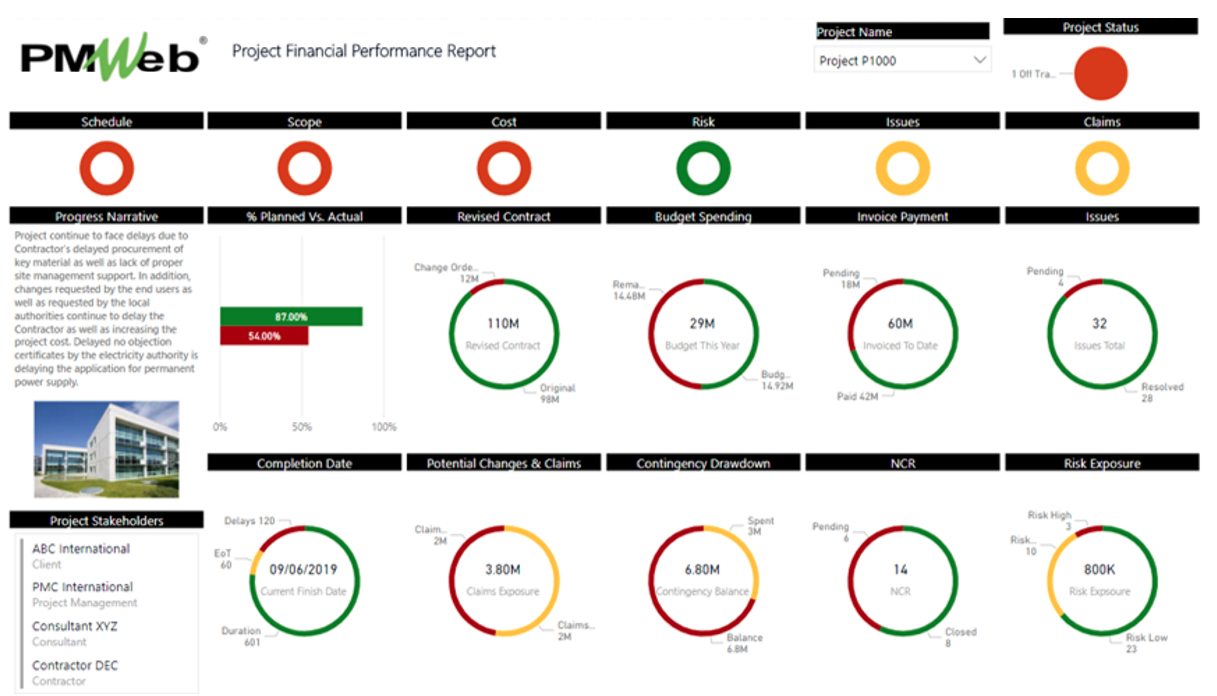
The third level of dashboard reporting will be the project level where the reporting will cover the different key performance indicators that will be common to all projects being delivered. Those would include performance indicators for schedule, cost, quality, health and safety, sustainability, procurement, risk, and others. In addition, the report will include a narrative to explain the current project status as well as construction site pictures.
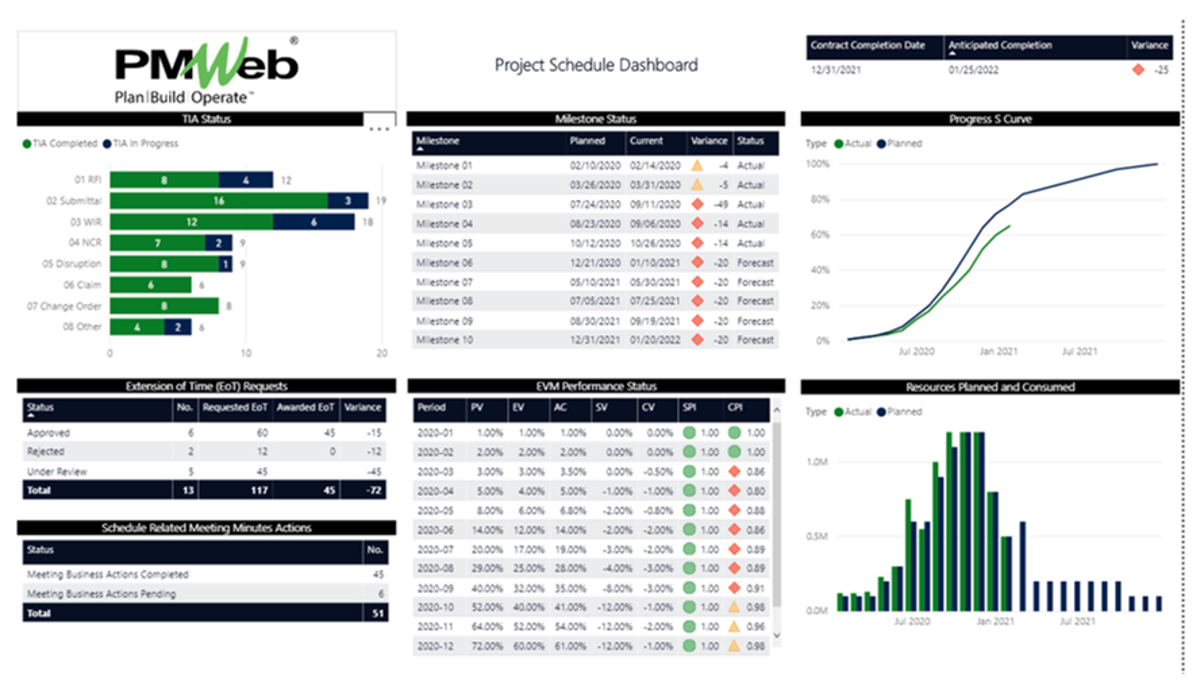
The fourth level of performance reporting will be the project management aspect reporting. Those could be many and they include schedule, cost, quality, health and safety, sustainability, procurement, risk, and others. For example, the schedule dashboard will include details on schedule milestone dates, planned versus actual performance curves, planned resources utilization compared with actual resource usage, an extension of time requests, and other relevant performance details.
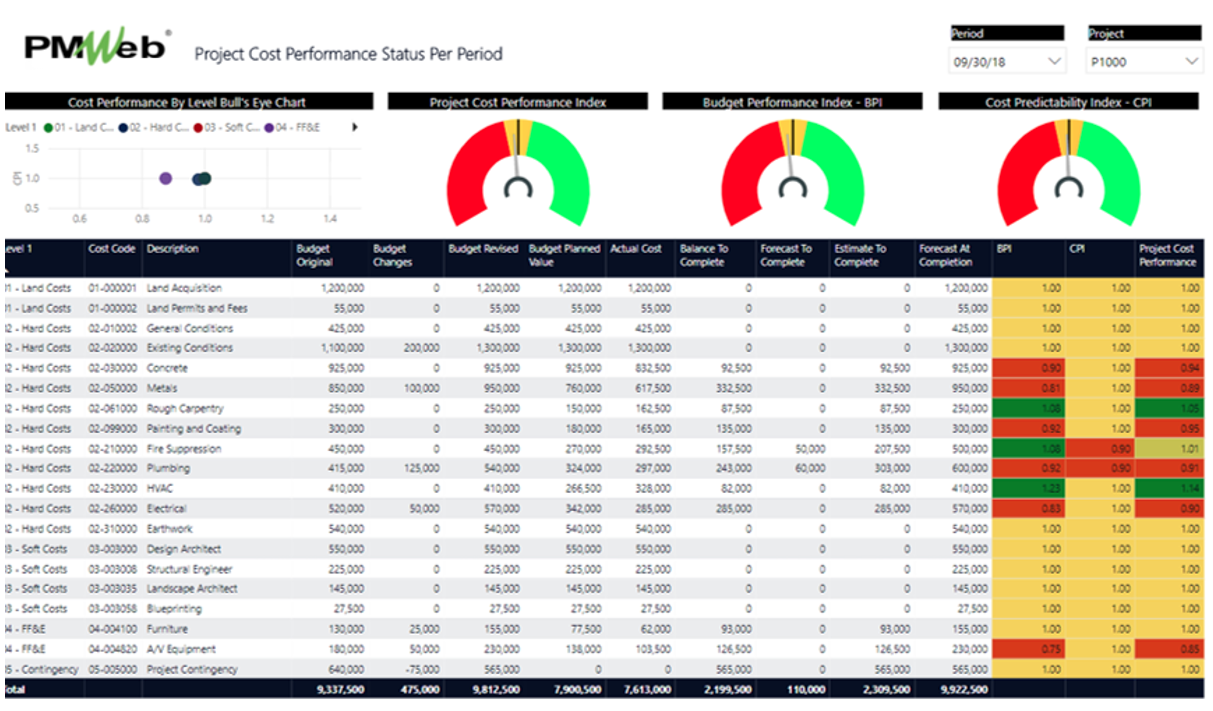
On the other hand, the cost dashboard will include details on the project budget, awarded commitments, potential, pending, and approved change orders, claims, interim payment certificates, and other actual cost data whether they were direct cost or indirect cost, and actual payments made against approved invoices. The dashboard would also include measures for earned value management performance (EVM) among others.
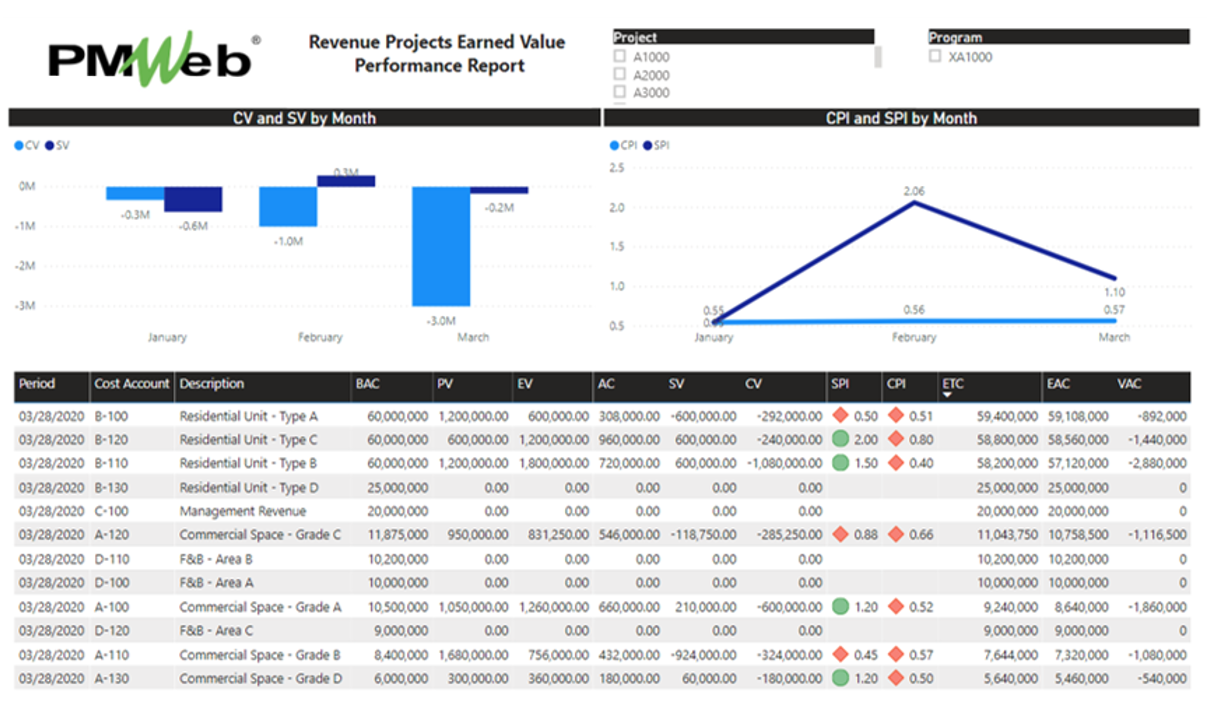
For projects that involve earning income for the completed work in place, there will be a dashboard to report on the performance of income contract agreements. Those could be for sales of assets, contractor contract agreement with the project owner, change orders, requisitions, and actual income received for issued invoices.
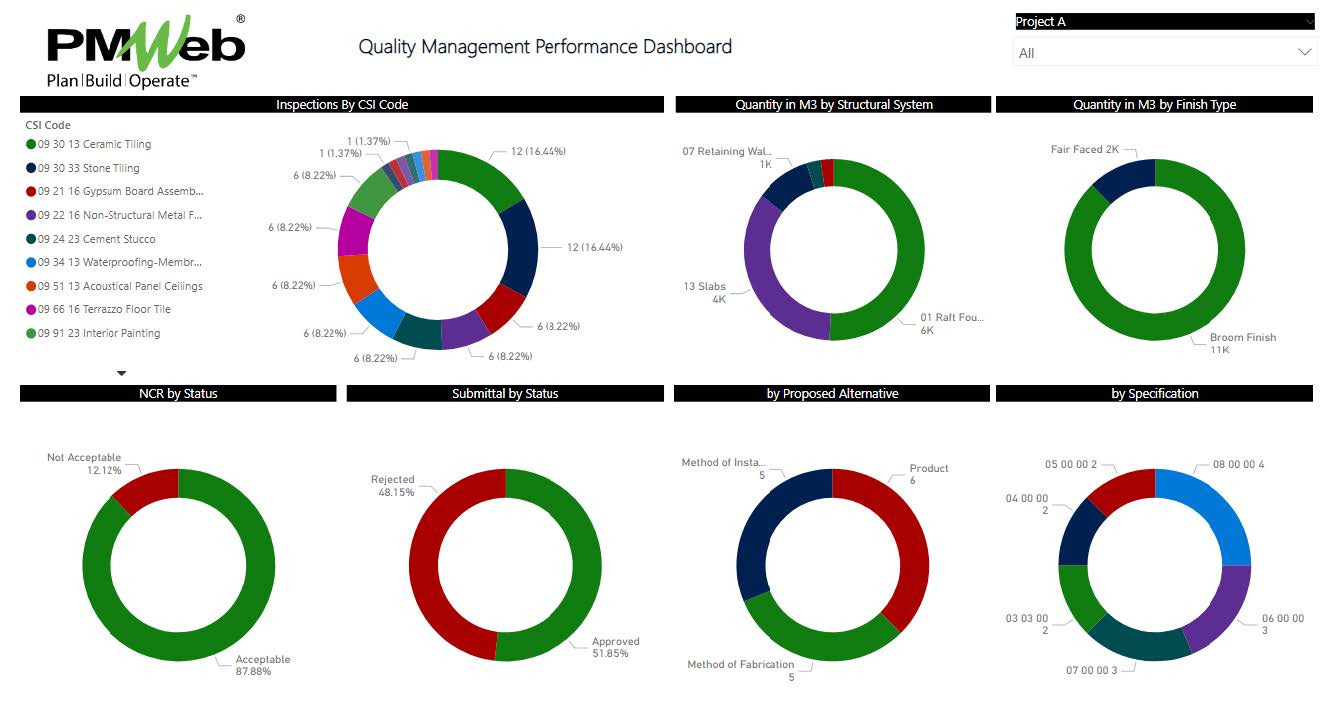
For those responsible for quality control and quality assurance, the quality management dashboard would be the dashboard they need to have. This will include the performance indicators on material submittals, work inspection requests IWIR), non-compliance reports (NCR), material substitutions, and other quality management business processes.
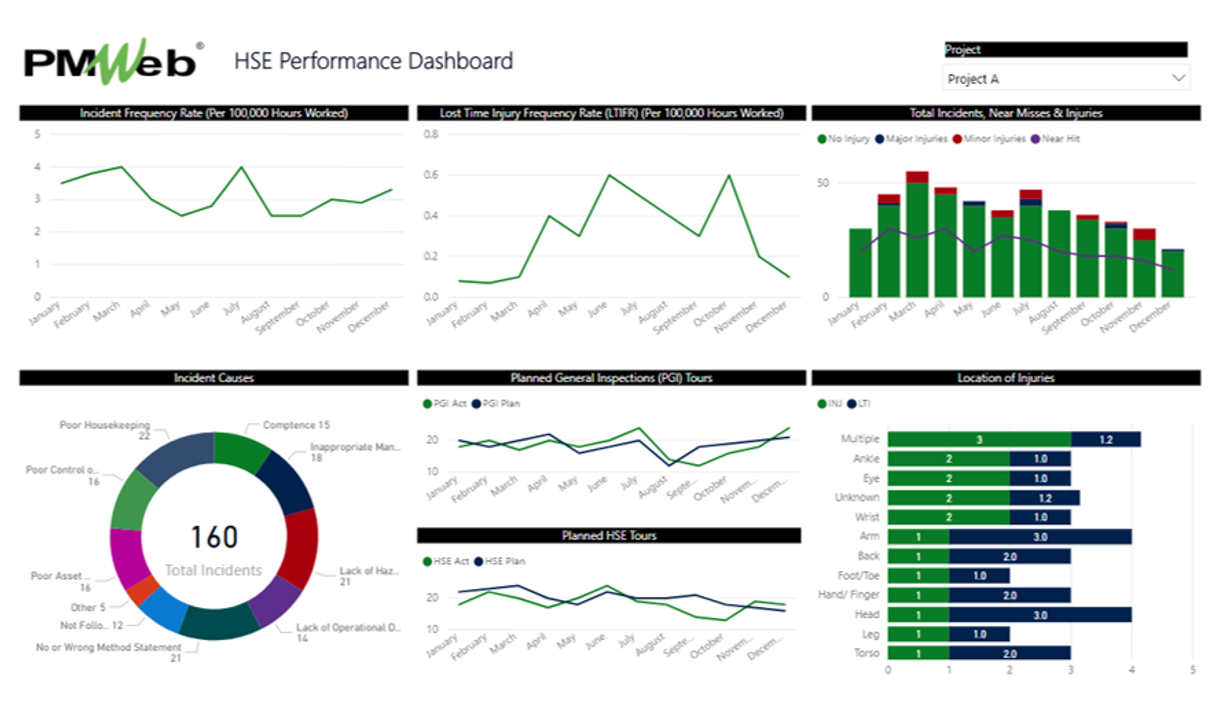
The health, safety, and environment dashboard will summarize the information of safety incidents, safety violation, incident frequency rate, lost time injury frequency rate, incident by causes, body locations where injuries occurred, planned versus actual safety inspections, permits to work by category, gate passes issued among others.
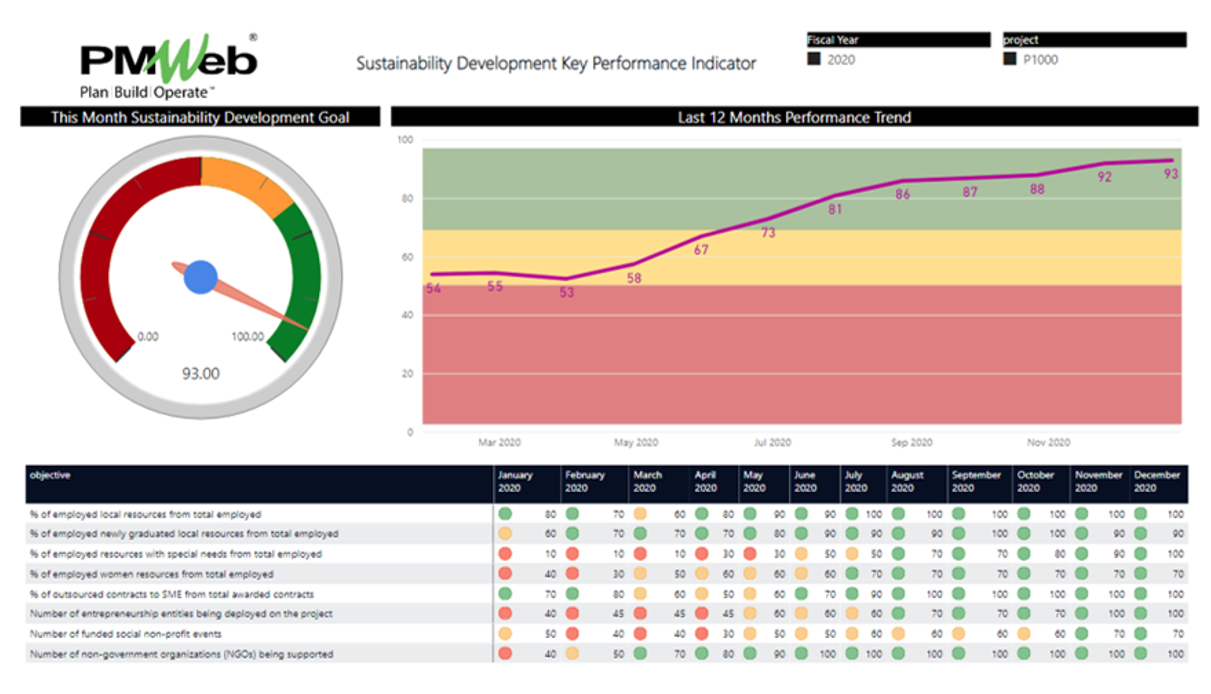
With the growing demand for ensuring that capital construction projects do contribute to sustainable development goals, many entities have started reporting on those objectives. Those could be to ensure that country nationals are taking an active role in delivering those projects, equality in involving women in the project delivery, creating job opportunities for those with special needs along with other objectives of the sustainable development goals.
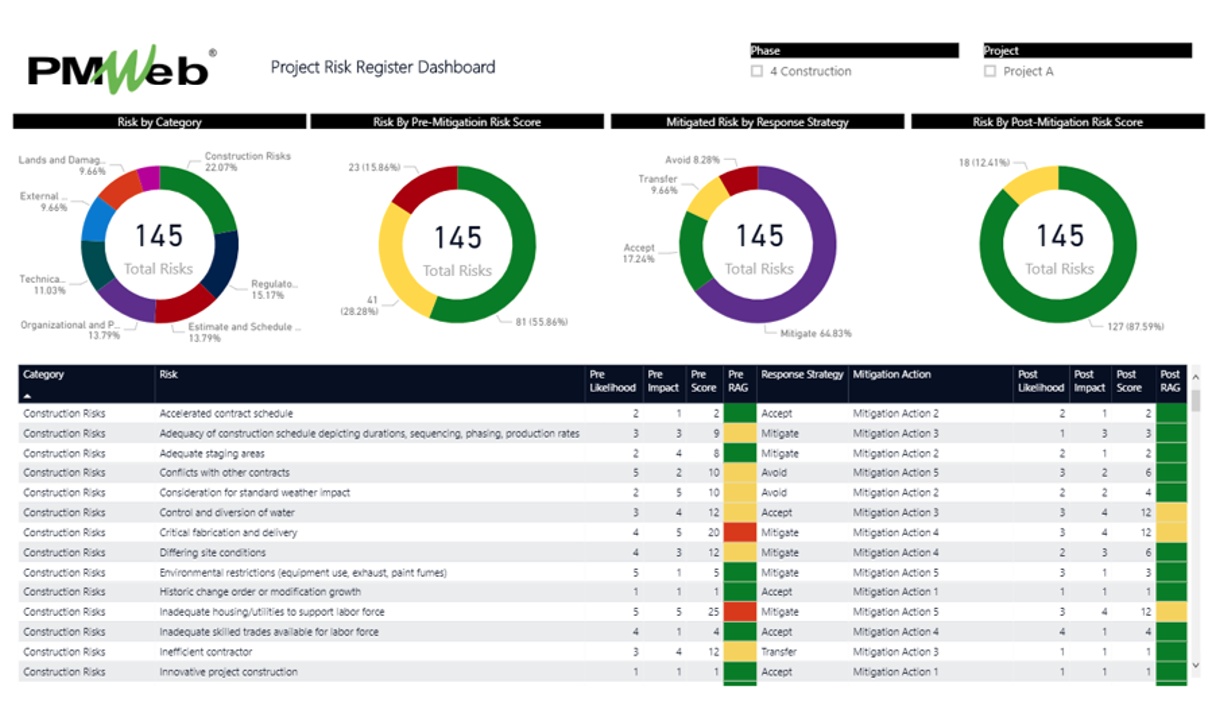
Of course, there could be many other project management dashboards like those for risk and issue management, procurement of contracts which will also include prequalification details, project communication that will cover business processes for the request for information (RFI), transmittals, site work instructions (SWI), confirmation of verbal instructions (CVI) just to list few.
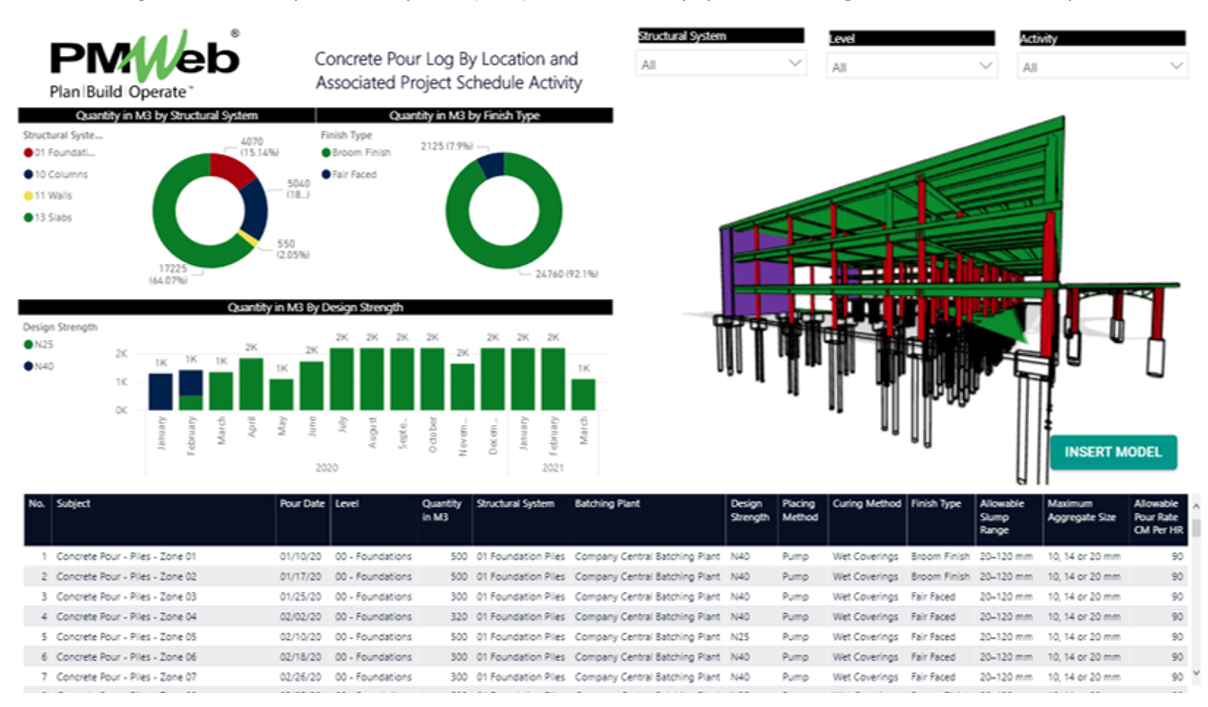
All of these dashboards that address the performance of the different project management aspects will depend on the different reports generated for the different business processes that had been digitally enabled in PMWeb, Primavera P6, Safran, and other applications including those for Building Information Modelling (BIM) software like Autodesk Revit. For example, the concrete pour log which feeds the quality management dashboard can be associated with the BIM model objects relevant to each reported concrete pour to show the location of those different concrete pours. The same could have been done with Request for Information (RFI), Change Order, Schedule Progress, Work Inspection requests (WIR), submittals, Equipment Testing, and other business processes.
The reader of any of those registers can drill down to each transaction listed in the report to find more details on what has been recorded in the transaction. This ability to drill down to the data source of whatever is being reported on ensures complete transparency, traceability, and audibility of how the captured data has impacted the reported project’s performance.
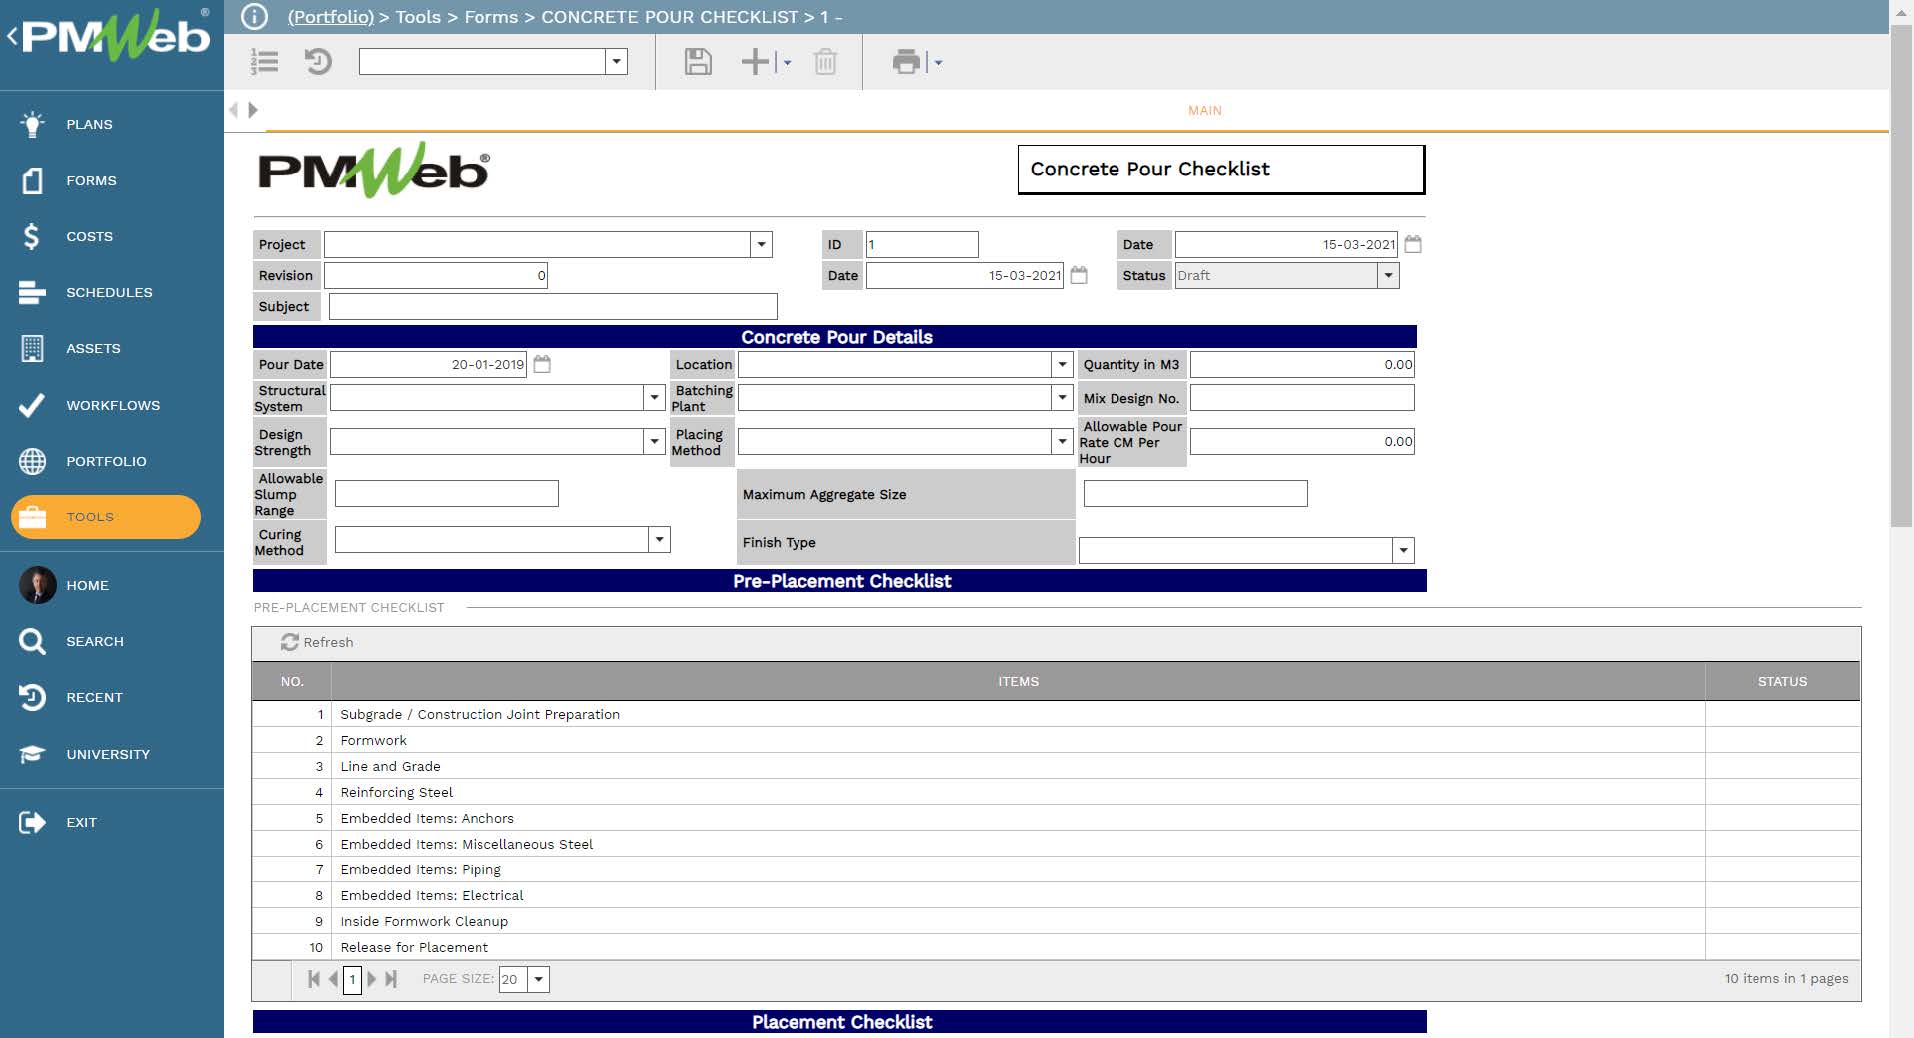
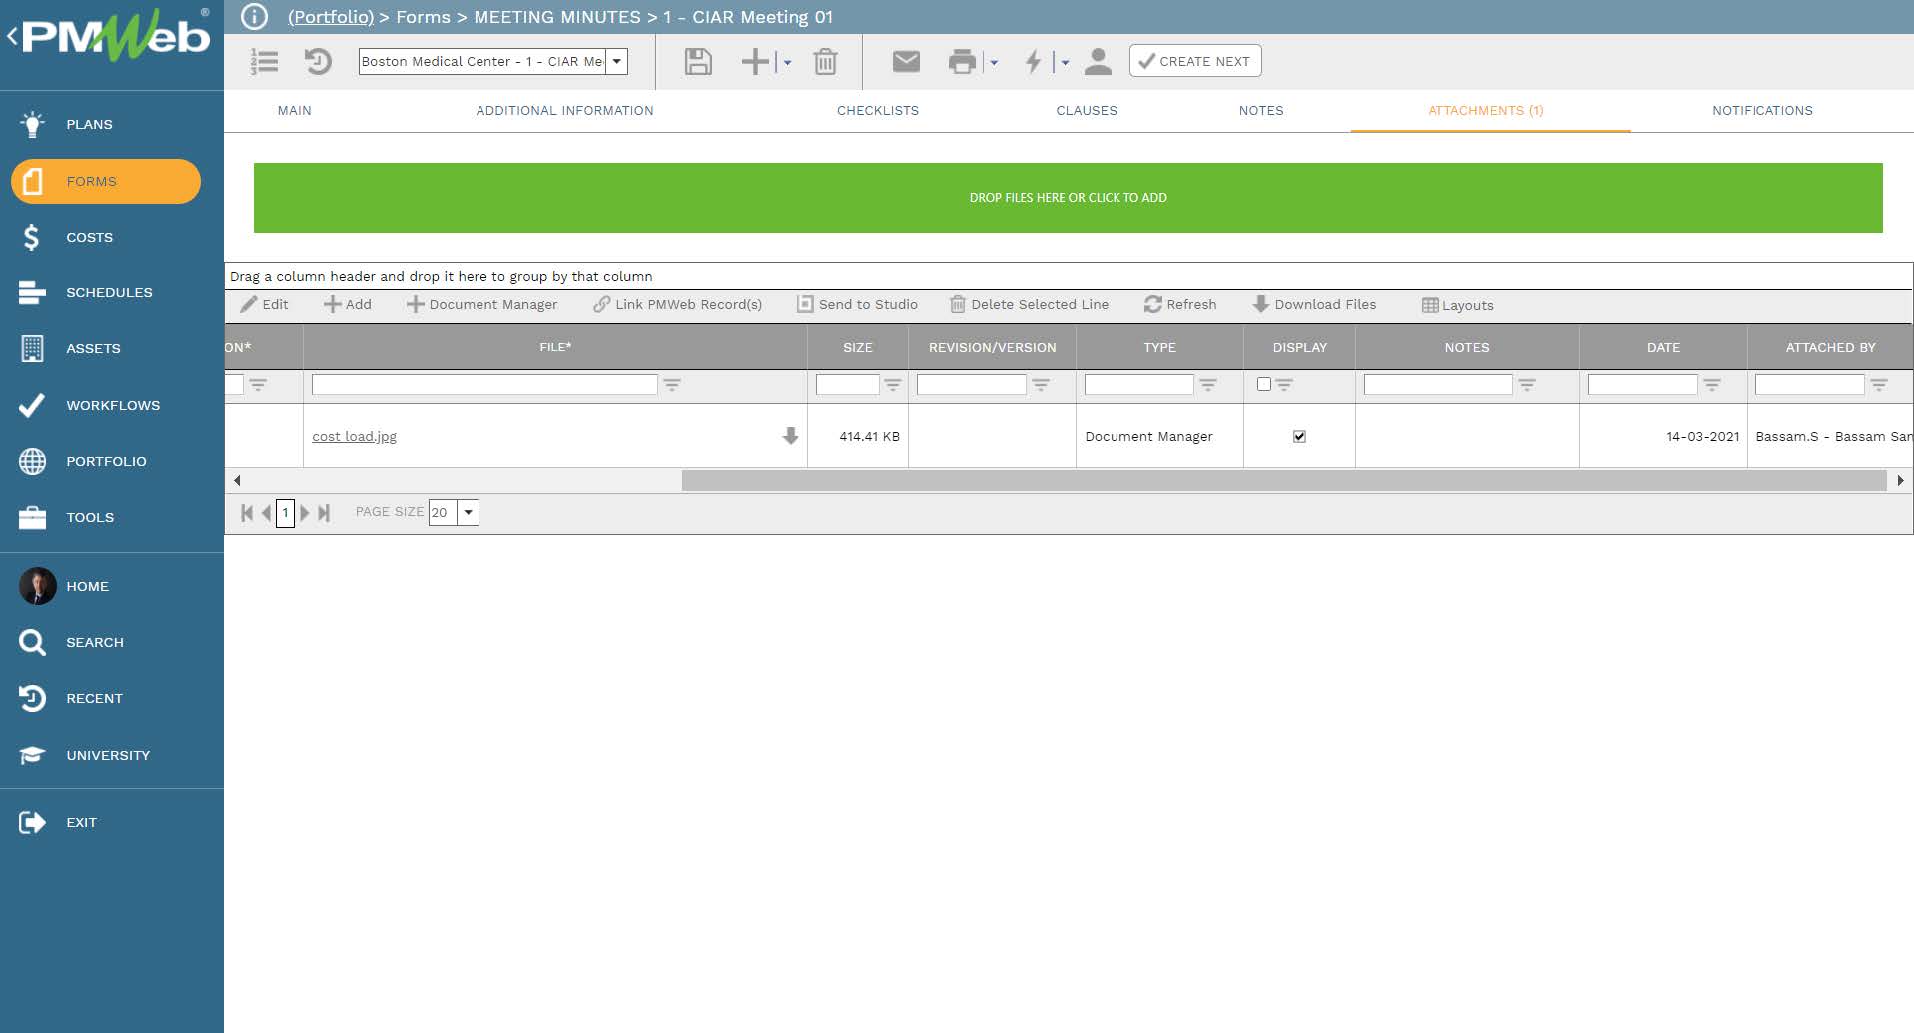
In addition, each transaction will be attached with all supportive documents that are relevant to the transaction. For example, the Concrete Pour Checklist form attachment tab will be used to upload and attach copies of the different concrete slump tests and other tests carried out for the concrete pour as well as copies of batch ticket numbers. In addition, pictures taken of the concrete pour process will be also uploaded and attached.
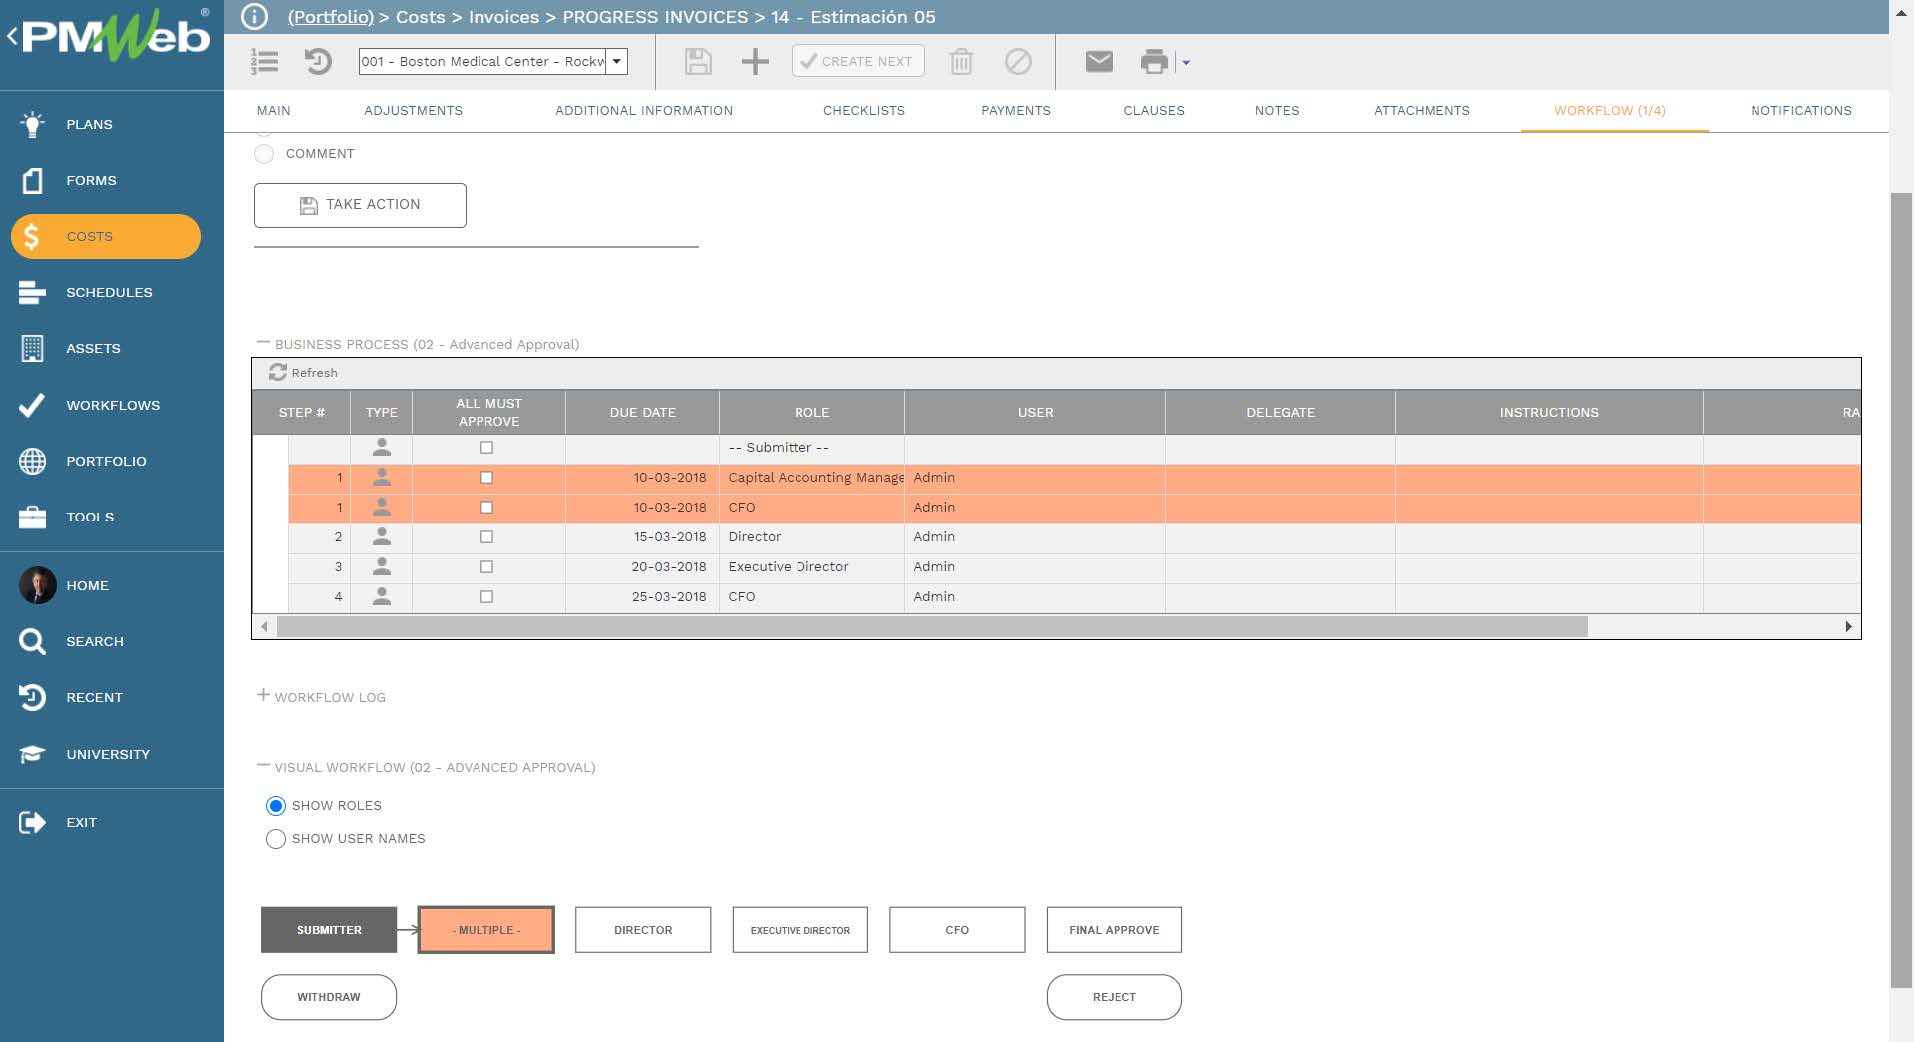
Further, the workflow assigned to the Concrete Pour Checklist similar to any other business process managed in PMWeb will be used to distribute the checklist to the intended recipients after it is submitted. The form will be initiated by the contractor and then the predefined workflow will distribute the Concrete Pour Checklist form to all designated project team members.
PMWeb workflow will identify the review and approve tasks, responsibility to perform, duration and available actions to be taken. This ensures accountability in all shared data that was the basis for all related reports and dashboards shared with the project stakeholders.
In other words, the data source for all performance dashboards and reports will depend on the everyday transactions associated with each business process needed to manage the capital construction projects delivery. Each transaction will record the needed data, attach all supportive documents and link all relevant records, and capture the actions taken by each individual who was set accountable to review and approve the recorded data.
The PMWeb Project Management Information System (PMIS) solution is an example of a 100% web-enabled platform that enables all entities involved in capital construction projects delivery to access real-time, single-version-of-the-truth dashboards for monitoring, evaluating and reporting on a projects’ performance. The value that a PMIS like PMWeb brings those entities is far more than transparency, accountability, and real-time single version of the truth, as it brings the platform that all historical projects data will be stored and saved to become readily available for Artificial Intelligence (AI) and Machine Learning (ML) platforms.