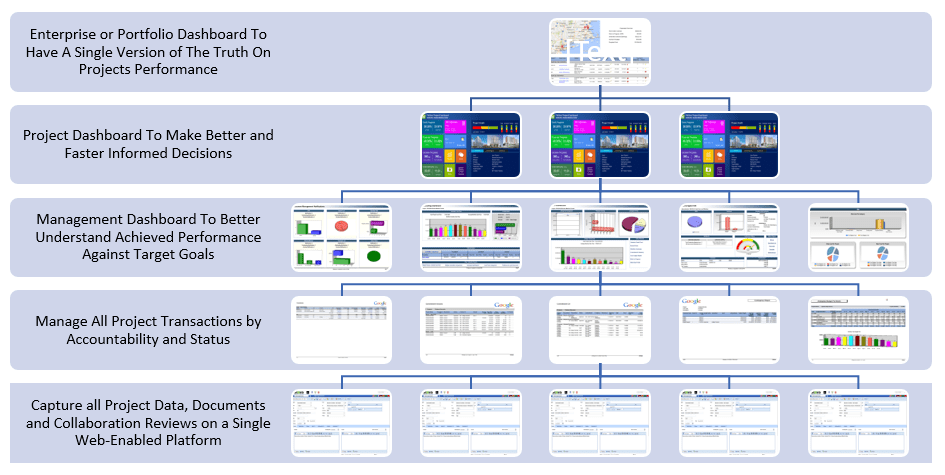
Driving a project to success requires having real-time project performance and status reporting to provide objective, clear and concise information of the key drivers of the project performance. Like a car dashboard, the project dashboard is crucial for the project stakeholders to provide them with the insight to make better and faster informed decisions that could affect the success of their journey or project life cycle stages.
The layout, information shared, level of detail, key performance indicators and other components of dashboards used by capital project owners, project management consultants, engineering consultants, contractors and other stakeholders vary depending on the needs and role of the dashboard recipient. Some of those recipients could be interested in having the overall performance of all projects being delivered by the organization or a portfolio of projects. Others could be interested to have the performance details of projects that are part of a program or a strategic initiative while another group could be interested in the details of a single specific project. In addition, some recipients might be interested in the performance details of a specific phase of the project life cycle like tender for design, design stage, bid/award, construction, testing and commission and turnover and closeout. Further, other recipients could be interested in performance details as it relates to project cost, schedule, risk, procurement of contracts, documents, quality assurance and quality control, health and safety, environment, sustainability among others.
All of those dashboards provide a real-time synopsis of the project performance information in a visual format that is easy to read, remembered and understood by the dashboard recipient. All this project information should be based on a single data source otherwise those dashboards could provide conflicting and contradicting information for the different recipients. The damage would also extend to the impact of taking uncoordinated decisions that although could help in addressing the issues of one recipient while creating new issues for other project team members. Therefore, unless the organization impose formal processes for capturing and sharing project’s data, the likelihood of having conflicting and contradicting information will always be very high.
Key Performance Indicator (KPI)
Similar to the gauges and other meters on your car dashboard, a project dashboard will always include a number of key performance indicators (KPI) to report on the performance, health and status of the project in a visual format. There are hundreds of KPIs that are being used by projects intensive organizations to help them manage the delivery of their projects’ portfolio. Some of those KPIs are used to manage the project scope, cost, schedule, documents, risks, issues, quality, safety, sustainability, stakeholders, communications among others.
The list below are some of the projects’ KPIs that were listed in the KPI Mega Library book by Dr. Rachad Baroudi (https://books.google.ae/books/about/Kpi_Mega_Library.html?id=vDvHbwAACAAJ&redir_esc=y) among others. Of course, there are many other books and manuals that provide examples of KPIs used in managing projects performance.
- # conflicts arisen during the project
- % decrease in complaints after project execution
- % of overdue project status reports
- % of overdue project tasks
- % of projects on time
- % of projects or resources allocated through business unit approval
- % of projects receiving Quality Assurance review
- % of projects with high risk profile
- % of projects with missed milestones
- % of projects with scope changes
- % of projects without deviation of planned hours of work
- # project cost performance index
- # project cost schedule index
- % budget allocated to budget spent ratio
- % of projects on budget
- % of projects on time and on budget
- % of projects without deviation of planned budget
- % project budget variance
- % projects on budget
- % Full Year Budget Vs. Full Year Actual Cost
- % Total consultant fee spent Expressed as a percentage of construction costs
- % Architect fee spend Expressed as a percentage of construction costs
- Total No. of RFIs
- Average Duration to Review and Respond to RFI
- Average Submittals Review All
- Average Submittals Review Shop Drawing
- Average Submittals Review Method Statement
- Average Submittals Review Supplier Qualification
- Average Submittals Review Sample
- Average Submittals Review As-Built
- Average Duration to Review and Approved Submittals – Shop Drawings
- Average Duration to Review and Approved Submittals – Material Samples
- Average Duration to Review and Approved Submittals – Method Statements
- Average Duration to Review and Approved Submittals – Supplier Qualification
- Average Duration to Review and Approved Submittals – As-Built Drawings
- Average Duration to Review and Approve Progress Invoice
- Average Duration to Make Payment of Approved Invoice
- Total No. of Issues
- Average Duration to Resolve Issues
- % Approved Time Extensions as a percentage of original project duration
- % Original Project Delays as a percentage of original project duration
- % Extended Project Delays as a percentage of original project duration plus approved time extensions
- % Approved Change Orders as a percentage of original contracts value excluding VAT
- % Disputed Change Orders as a percentage of original contracts value excluding VAT
- % Project Management Team Members Turnaround of total number of project management team members
- Total No. of Employer Complaints
- Total No. of Issued NCR – Quality
- Total No. of Issued NCR – HSE
- # of accidents per year.
- # of reportable accidents year.
- # of reportable non-fatal accidents per year.
- # of solved safety non-conformance for the month.
- % of corrective actions closed out within specified time-frame.
- % of fatal accidents relative to all accidents per year.
- % of staff with adequate occupational health and safety training.
- Total of hours in safety and health training in the month.
- % of attendance at occupational health and safety committee meetings.
- % of health and safety representatives’ positions filled.
- % of issues raised by H&S representatives acted.
- % of occupational health and safety committee recommendations implemented.
- Cost of solved safety non-conformance for the month.
- Health and safety prevention costs within the month.
- Lost time (in hours) due to non-fatal accidents per year.
- Lost time (in hours) due to accidents (including fatalities) per year.
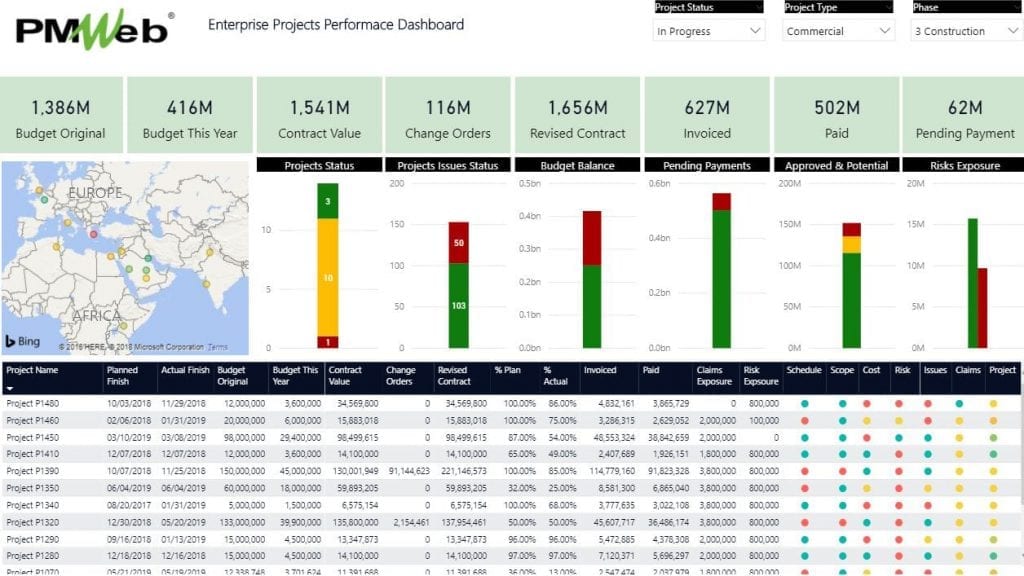
For example, the KPI “% Full Year Budget Vs. Full Year Actual Cost” is used to report on the ratio of the total project cost to the full year allocated budget. The total project cost is the approved total value of work in place submitted by the contractors using the monthly progress invoice during a specific fiscal year. The full year allocated budget is amount of budget that has been reserved for this project to complete the scope of work planned for the same fiscal period along with contingency allowance for scope creep and variations.
The objective of this KPI is to measure the project management team’s ability to meet forecasted expenditure targets committed by the project owner. Failing to spend the expenditure targets means that those funds are sitting idle without generating the value that they are supposed to produce as well as depriving other projects from using those funds to pay for work in place. On the other hand, if actual cost spending exceeds the allocated budget spending, then the organization will not be able to fulfill its obligation to make payments for the completed works which could result in a claim for failing to pay or delayed payments.
The performance threshold for this KPI can differ from one organization to another but the best score is achieved when the actual cost coincides with the allocated budget spending. The preferred performance, or the green zone, could allow +/- 5% variance. The warning, alert or amber zone could allow from +/- 5% to +/- 10% variance while the red zone will be any variance that exceeds +/- 10%.
How Can Technology Help in Creating Trustworthy KPIs?
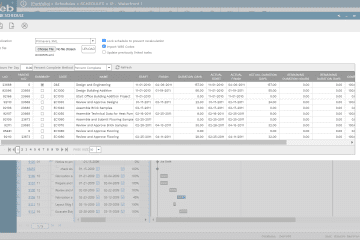
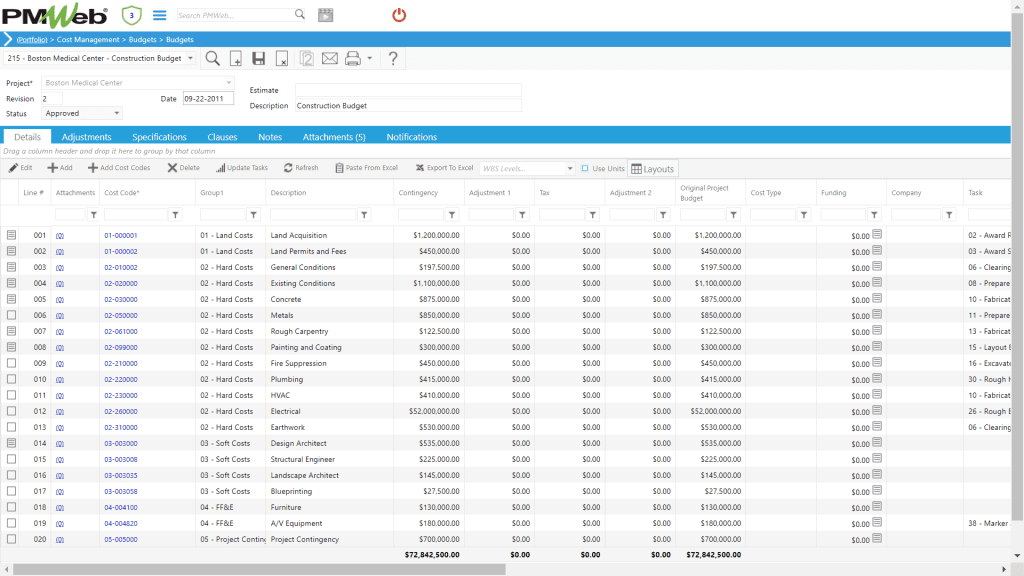
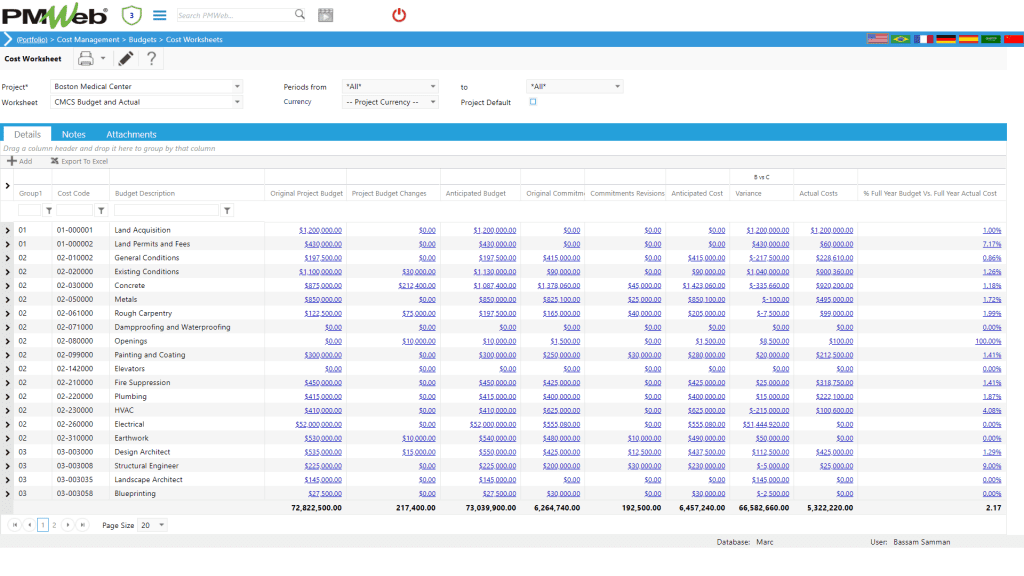
Using PMWeb Project Management Information System (PMIS), the KPI “% Full Year Budget Vs. Full Year Actual Cost” used as an example will be calculated using PMWeb default modules, starting with the project budget which will be detailed to the desired level of detail. This will be followed by distributing the budget value for each line item into the project’s performance periods. The distribution will be aligned with the project’s schedule and how the allocated budget will be spent for each line item. This will enable the project team to have a spreadsheet report that summarizes the planned budget for each period. For a specific fiscal year, the planned budget value for that particular year will be summed up.
For the actual cost spending, PMWeb Progress Invoices module will be used to capture the details of the work in place for each period. When the progress invoice is formally reviewed and approved, it becomes the actual cost that the project owner needs to pay. PMWeb captures the progress invoices details for all awarded project contracts and the progress invoices for each period. The actual cost will include the approved work in place, materials on site and payments against approved variation orders. The actual cost for a specific fiscal year will be the total of all approved progress invoices approved within that year for all awarded contracts.
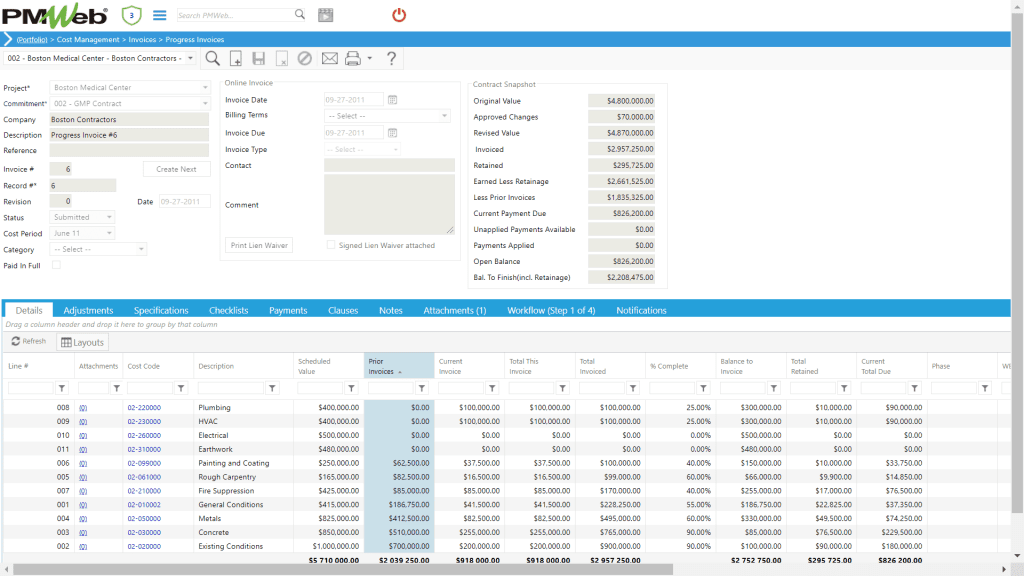
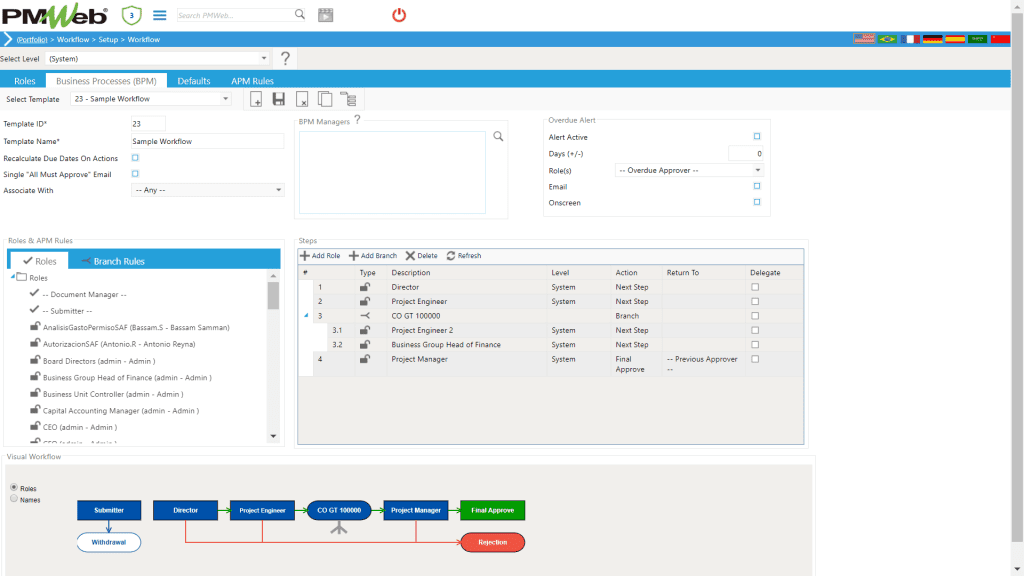
For each form, there will be pre-defined fields to capture the needed data for the needed information. Those fields could be assigned for different project team members to fill depending on the authority levels assigned to each. In addition, supportive documents such as the awarded agreement document and other details can be attached to the form to further enforce transparency. The completed form can be assigned a workflow to formalize the submit, review and approve steps to enforce accountability. Those workflow steps will be in line with the project manual which sets the procedures for managing the different project processes.
The automatically generated cost worksheet not only will eliminate the requirement of having to create them using MS Excel, but also helps in enforcing the trust worthiness of the information included in those reports. In addition to the option of displaying default cost fields, the cost worksheet allows creating formulas to automatically generate the needs key performance indicators. For example, in this case it will be used to automatically calculate the “% Full Year Budget Vs. Full Year Actual Cost” KPI.
Unlike most other PMIS solutions, PMWeb allows creating multiple cost worksheets for each project to display different cost fields as well as calculated KPIs. In addition, the user can drilldown to the forms used to capture the project budget, awarded contracts and progress invoices are examples of the many forms that are available out-of-the-box from PMWeb. In addition, the custom form builder enables creating unlimited number of new forms when needed.
Many of the needed KPIs will be calculated in PMWeb Report Writer tool or any other Business Intelligence and Data Visualization tool which will be used to create the many different tabular and graphical reports and dashboards. Actually, it also very common that there are some KPI values that depend on the value of other calculated KPIs. For example, the organization could have a single KPI to report the overall performance of each project. This KPI could be based on other KPS like the project safety performance indicator, multiple cost performance indicators, multiple schedule performance indicators and quality performance indicator. Each one of those KPIs would have weight factor for which the overall project performance KPI will use to determine how good the project is performing as an overall
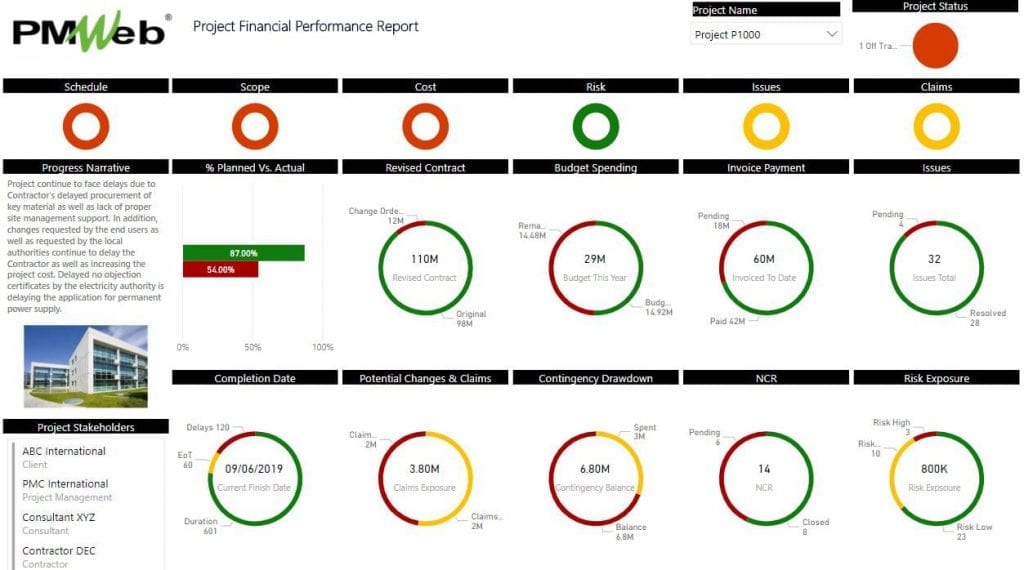
The drilldown approach adopted in PMWeb BI report writer in creating the projects’ dashboards enables the decision maker or dashboard reader to drilldown to the data source from which the KPI was created. The reviewer can view the record and the documents attached to the record as well as the workflow steps which detail who approved the record and if there any comments made. This will ensure trusting the information and measures being communicated.