For all entities that are involved in delivering capital construction projects, including the Project Owner, Project Management Consultant, Engineering Consultants, General Contractors, EPC Contractors, Design-Build Contractors, and Subcontractors, can use the integrated Primavera P6 resource-loaded project schedule and actual resources data captured and formally using project management information to monitor, evaluate and report on the efficiency deployed resources, labor, and non-labor, to deliver the project’s scope of work. This information is needed to enable monitoring, evaluating, and reporting on any variances, the reasons that have caused those variances, and the actual performance efficiency achieved to date to enable them to implement the needed corrective measures as soon as unfavorable performance variances are identified to improve the efficiency of resources for delivering the remaining scope of work to avoid resources overrun which will result in project cost overrun.
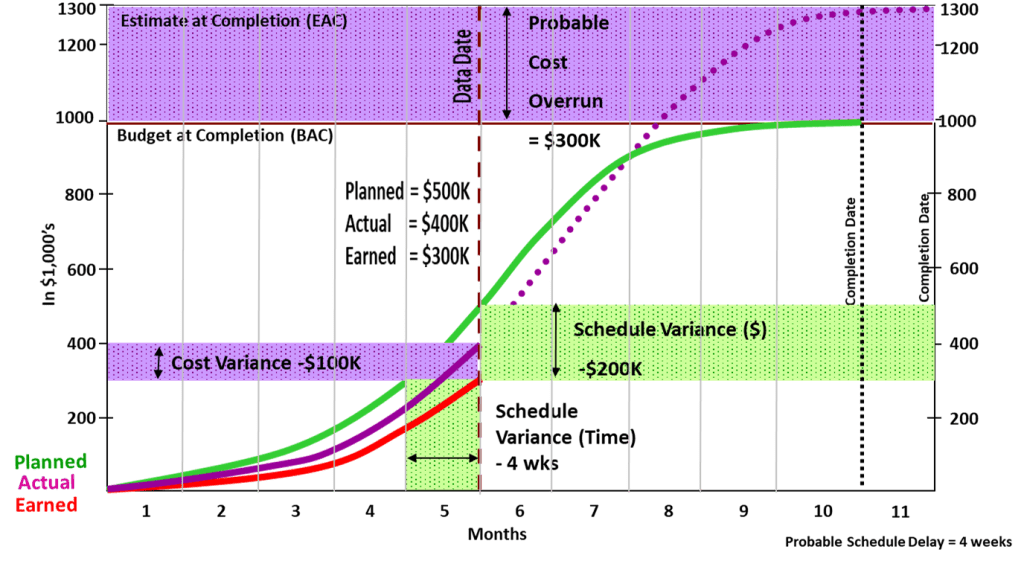
The Earned Value Method (EVM) is one of the proven project management techniques used for monitoring, evaluating, and reporting the performance of deployed resources as well as it provides a trusted technique to forecast the expected resource hours at completion. The concept of EVM is based on managing four variables, the project approved resource quantities (BAC), the quantities of the planned resources for the scheduled scope of work (BQWS) also known as Planned Quantity (PQ), the actual resource quantities for the performed scope of work to date (AQWP) also known as Approved Quantity (AQ) and the budget quantities of resources for the performed scope of work to date (BQWP) also known as Earned Value (EV)
Determining the Budget at Completion and Planned Resources Quantities for Scheduled Scope of Work (BQWS)
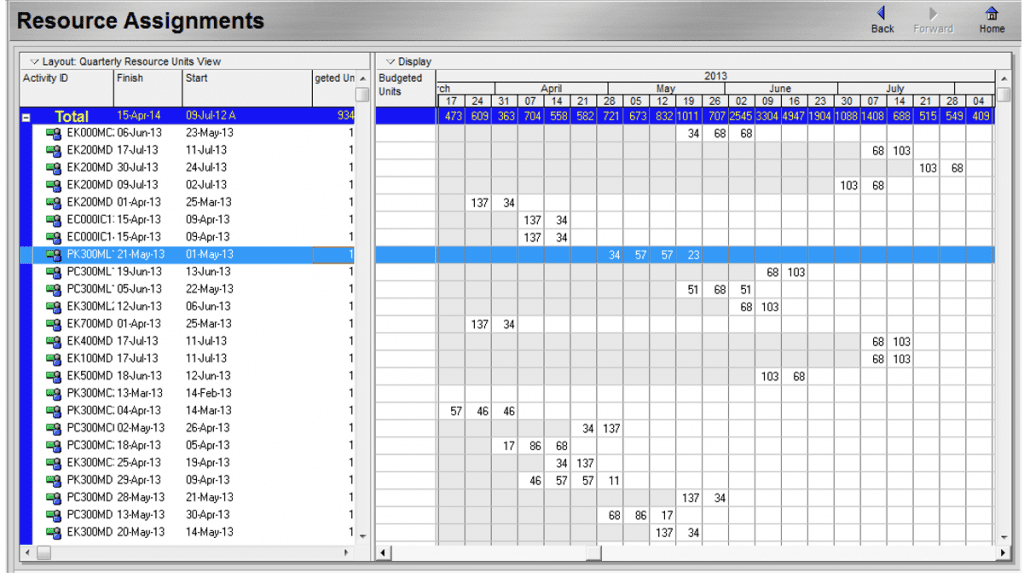
Usually, Oracle Primavera P6 or Microsoft Project will be used to plan to determine and plan the resources requirements during the project’s execution period. Each project schedule activity will be loaded with the labor and non-labor resources needed to deliver the scope of work associated with the activity. The total resources hours per activity is the Budget at Completion (BAC) for that specific activity for which when all project schedule activities are summed, the project’s Budget at Completion (BAC) will be calculated. The project schedule’s resources requirement will be leveled to the extent possible to avoid having resource overload. Upon completion of this analysis, Oracle Primavera P6 or Microsoft Project will automatically generate the Planned Resources Quantities for Scheduled Scope of Work (BQWS) at the end of each period which is usually on a weekly basis. The resources assignment report displayed below is an example of this output report.
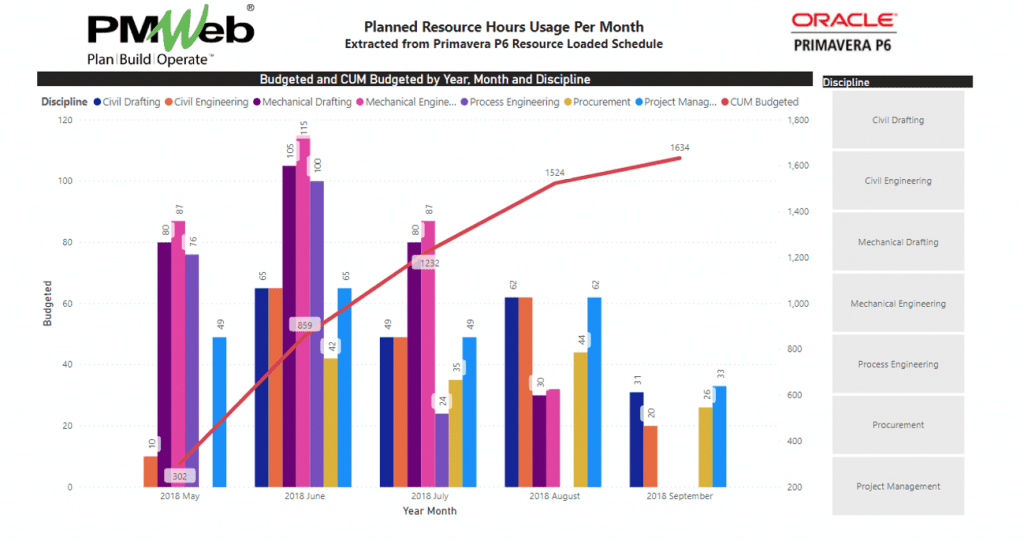
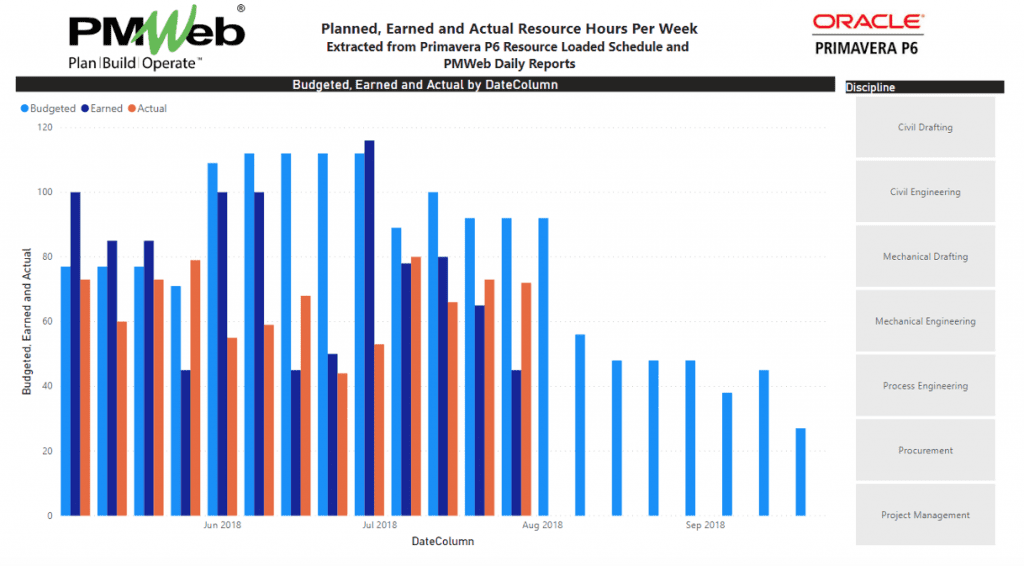
The resources-loaded schedule can be extracted and used to create an interactive resources histogram report using Microsoft Power BI. The details of the resources data extraction and display in Microsoft Power BI can be found in the article titled “How to Import Primavera P6 Data into Power BI” by Mannix Carney (https://projectplanninghq.com/how-to-import-primavera-p6-data-into-power-bi/). The Microsoft Power BI report below was provided by Mannix Carney to help us to present the value of associating the data captured in Primavera P6 and PMWeb applications. The report displays the resource hours by discipline on monthly basis and the cumulative budgeted planned hours curve or Planned Value (PV) for the resource-loaded project schedule.
Budget Quantities of Resources for Performed Scope of Work to Date (BQWP)
The Oracle Primavera P6 or Microsoft Project schedule needs to be updated on weekly basis to provide the status of all activities that have started, progresses, or completed. This will enable determining the physical percent complete of those activities. By multiplying the approved percent complete by the resources Budget at Completion (BAC) value for each activity, Oracle Primavera P6 or Microsoft Project will calculate the Budget Quantities of Resources for Performed Scope of Work to Date (BQWP) value.
Actual Resource Quantities for Performed Scope of Work to Date (AQWP)
To ensure that the actual resource, labor, and equipment, hours for the progressed activities are trust-worthy, auditable, and traceable, the actual resource hours need to be captured directly from the data source which could be a daily report for on-site activities or timesheets for office related activities. Using a Project Management Information System (PMIS) like PMWeb where those two modules are available by default, this can be achieved.
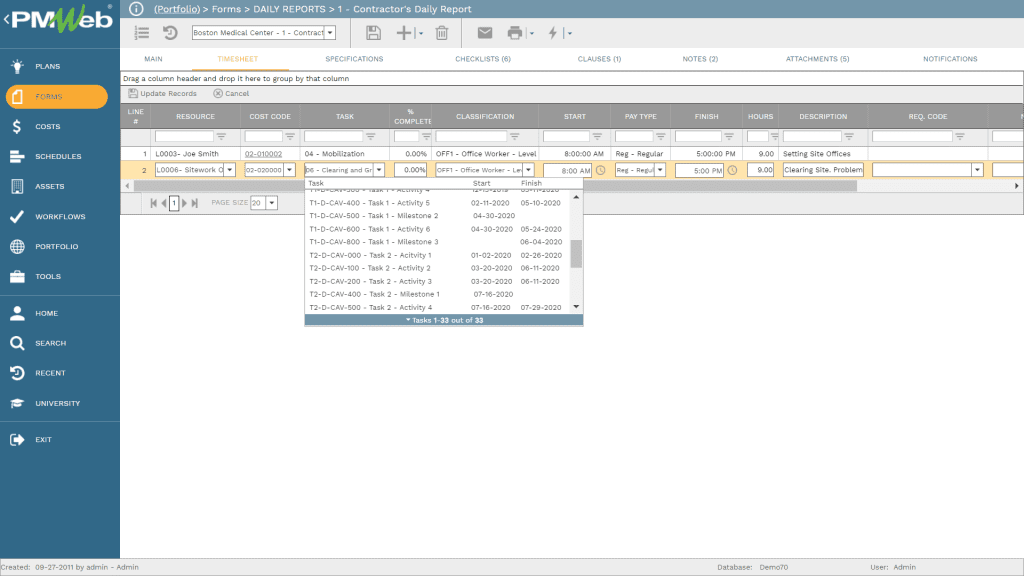
The main tab of the PMWeb daily report will be used to capture the details of the completed work in place while the timesheet tab will be used to capture the actual resources used to perform the work in place. All actual resource hours will be linked with the project schedule activity that those resource hours were spent. The daily report also allows capturing if those actual resources were done as overtime pay, weekend pay, or holiday pay. It is highly recommended that each project engineer creates and submit his/her work in place daily report.
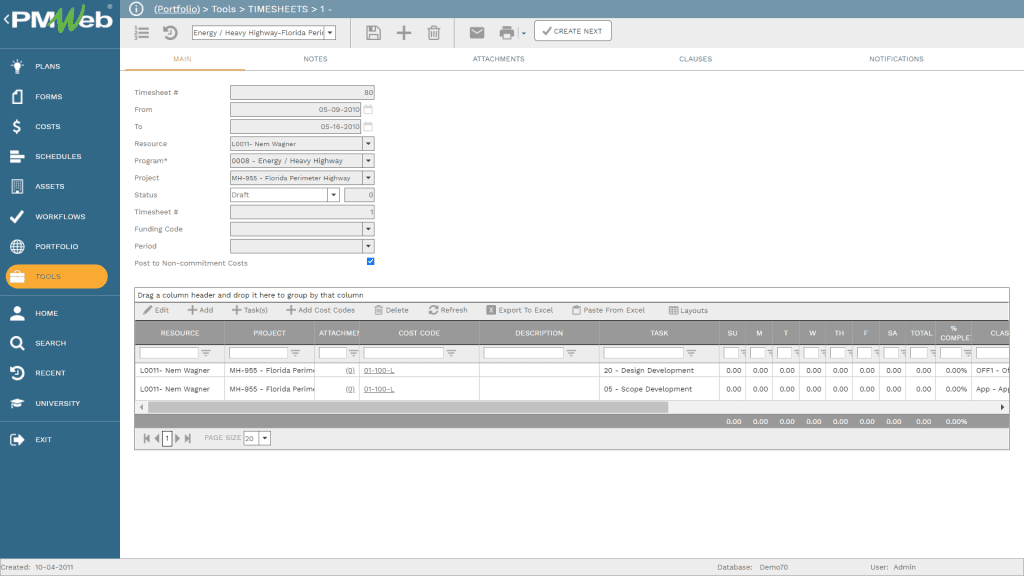
PMWeb timesheet module will be used to capture the actual resource hours for project management resources and any other resources, labor or equipment, that are not captured in PMWeb daily report module. Similar to the daily report module, the timesheet module also allows capturing if those actual resources were done as overtime pay, weekend pay, or holiday pay. Separate timesheets can be created for each resource or each team leader can capture the details of the resources of his or her team. PMWeb timesheet allows recording hours against multiple projects if needed.
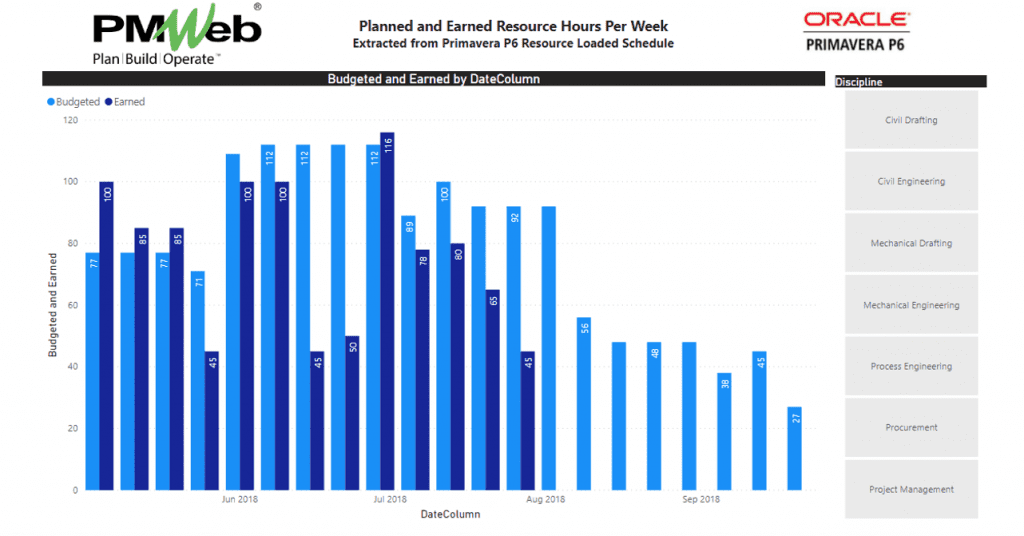
Using the same business intelligence reporting (BI) reporting tool that is Microsoft Power BI, the list of activities and Actual Resource Quantities for Performed Scope of Work to Date (AQWP) captured in PMWeb daily reports and timesheets will be imported. Since the two imported tables share the same project name, activities number, and resource names, the BI reporting tool will automatically associate the data source tables of Primavera P6 or Microsoft Project and PMWeb.
Calculating, Monitoring, Evaluating and Reporting the Earned Value Management (EVM) Performance Metrics
The data captured in Primavera P6 or Microsoft Project and the data captured in PMWeb will be used to calculate the different earned value management (EVM) metrics. The first of those will be the Schedule Variance (SV) which the difference between the Budget Quantities of Resources for Performed Scope of Work to Date (BQWP) and the Planned Resources Quantities for Scheduled Scope of Work (BQWS). A negative Schedule Variance (SV) value will indicate a delay in spending the planned resources which is not favorable as this might also indicate a delay in the project schedule. In addition, the Schedule Performance Index (SPI) which reflects the efficiency in spending the planned resources as of today will be also calculated by dividing the Budget Quantities of Resources for Performed Scope of Work to Date (BQWP) over the Planned Resources Quantities for Scheduled Scope of Work (BQWS). A Schedule Performance Index (SPI) value that is higher than one is considered favorable.
Microsoft Power BI will also be used to calculate the additional earned value management metrics. Those will include the quantity variance (QV) which is the variance between the Budget Quantities of Resources for Performed Scope of Work to Date (BQWP) and the Actual Resource Quantities for Performed Scope of Work to Date (AQWP). A negative value indicates that the actual hours spent for completing the relevant project schedule activity exceeds what was planned for which is not favorable. Another related metric is the Quantity Performance Index (QPI) which reflects the efficiency in using the project’s resources which will be calculated by dividing the Budget Quantities of Resources for Performed Scope of Work to Date (BQWP) and the Actual Resource Quantities for Performed Scope of Work to Date (AQWP). A Quantity Performance Index (QPI) value that is higher than one is considered favorable.
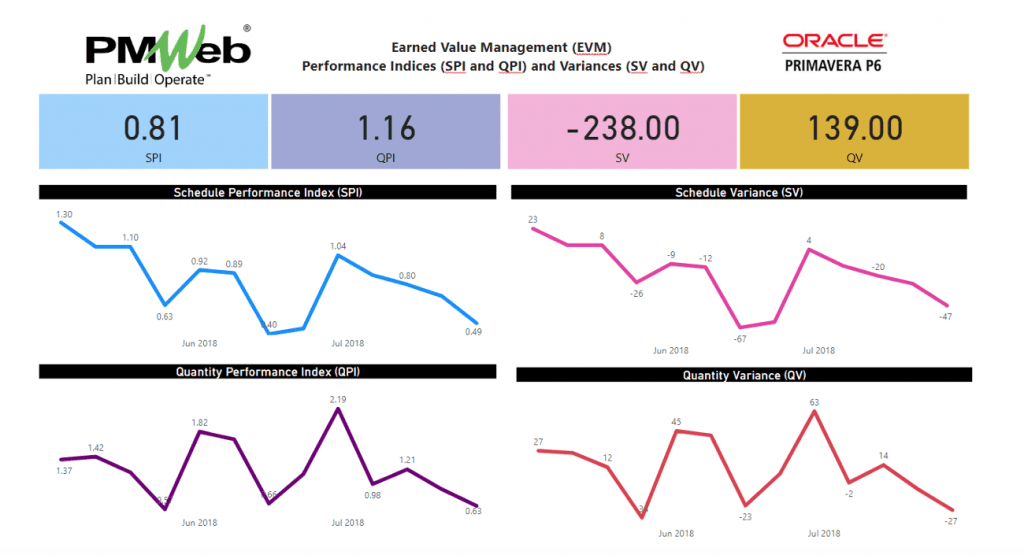
In addition, the Microsoft Power BI reporting tool can be used to calculate the remaining earned value metrics will include the Estimate to Complete (ETC) which equals (BAC – BQWP) for which could be adjusted depending on the actual performance for the elapsed periods. The adjustment will be captured in a field called Performance Factor (PF) which can be based on the average QPI performance value for the last three periods, a combination of SPI and QPI or any other factor that can reflect the performance trend for the remaining project period. The PF can be specific to a specific resource, group of resources or all resources. The Estimate to Complete (ETC) which equals (BAC – BQWP) will be adjusted by the Performance Factor (PF) to calculate the adjusted Estimate To Complete (ETC Adjusted). The Estimate at Completion (EAC) which equals (AQWP + ETC Adjusted), To Complete Quantity Performance Index (TQPI) which equals (BAC – BQWP) / (EAC – AQWP) and Variance at Completion (VAC) which equals (BAC – EAC).

