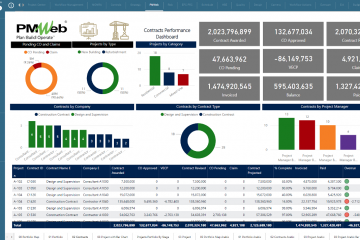
One of the critical requirements for those assigned to deliver capital projects is securing executive sponsors’ support for their projects. The list of executive sponsors could include the organization’s CEO, CFO, and other CxOs, the board of directors, department heads, and the key beneficiaries of the completed project facilities. Unlike other project stakeholders, those executives want to have an overall status of how projects, programs, and projects’ portfolios perform. Most of those sponsors would need to have access to trust-worthy reports to monitor and evaluate the project, program, or projects’ portfolio performance status. They need to have access to reports with visuals to convey what is required to know straight to the point. Those reports, also known as dashboards, need to be available to be accessed by those sponsors anytime, anywhere using any device.
Project Management Information Systems (PMIS) like PMWeb will ensure the trustworthiness of reported information by automating the different project management processes needed to manage the capital projects delivery. Pre-defined input forms for each process will ensure captured data quality and transparency. Having pre-defined workflows for those processes will provide timely and accountable review and approval of the captured data. The Big Data generated from those project management processes across the organization’s complete projects’ portfolio will become available to be monitored, evaluated, and reported on to the different stakeholders, including the executive sponsors.
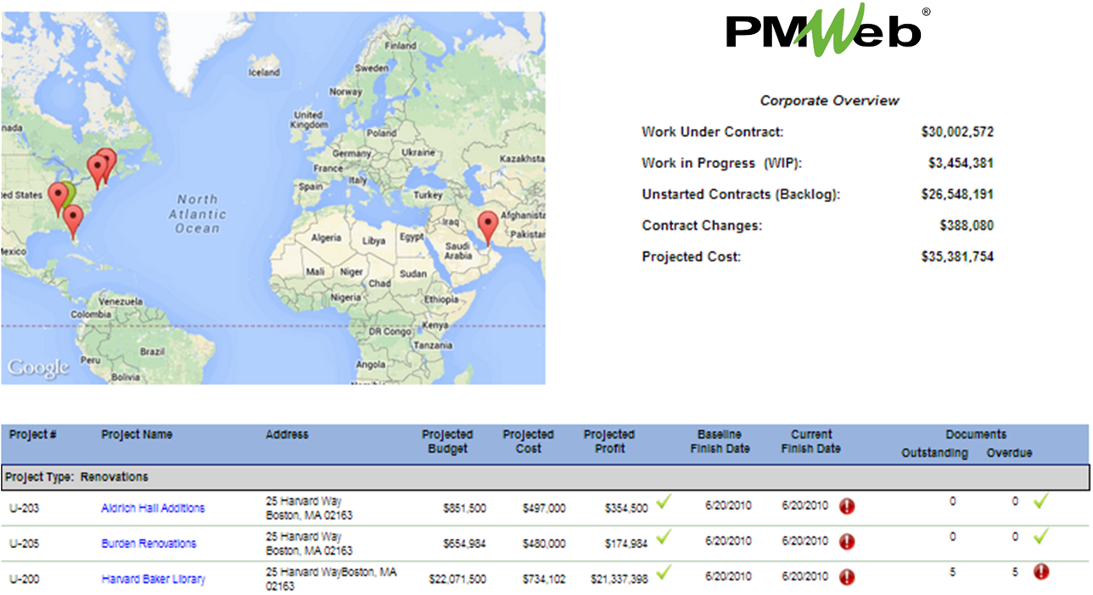
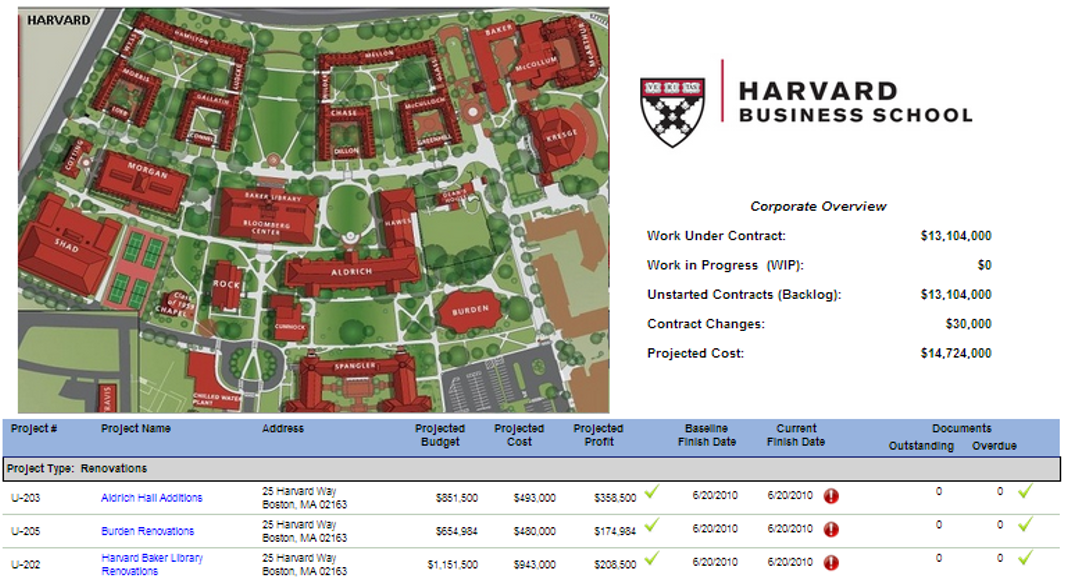
There are four levels of dashboards that could exist when it comes to reporting capital projects performance. The first is the enterprise or portfolio dashboard, for which the complete project portfolios that the organization has will be reported. Usually, those dashboards will have three components. The first will be the summary scores where for example, the total capital projects’ budget, awarded contracts, invoiced to date, among other data values, will be summarized. The second component will be a map visual to display the location of those capital projects with an indicator of their performance status, such as Green for good performance. In contrast, Red for unfavorable performance, while the third component will be a scorecard to provide each project’s critical performance status details. Of course, all dashboards will include the option to filter and select the projects and program to be reported on.
The second dashboard-type will be similar to the enterprise or projects’ portfolio dashboard, except that it will be program-specific. Those could be, for example, a University Campus, Medical City, Community Development, Internal Roads and Drainage, Railway, Metro, among others. The program dashboard will only display the projects that are part of the program being reported on. Further, and instead of the map visual of the projects portfolio dashboard, the program dashboard will include a layout showing the boundaries of the program’s projects.
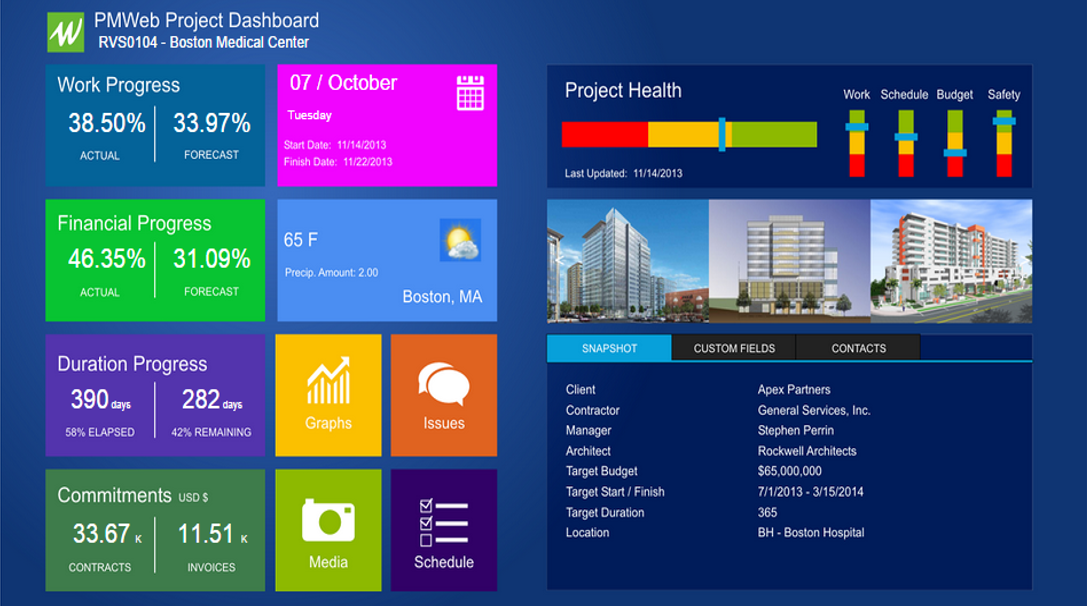
The third dashboard-type will be the project dashboard, where the displayed information will be specific to a single capital project. This information could include project schedule, financial, quality, health and safety, and other critical project performance information. The dashboard will also include pictures that show the current project’s performance status with the option to link those pictures to a site camera to display the current project’s site status.
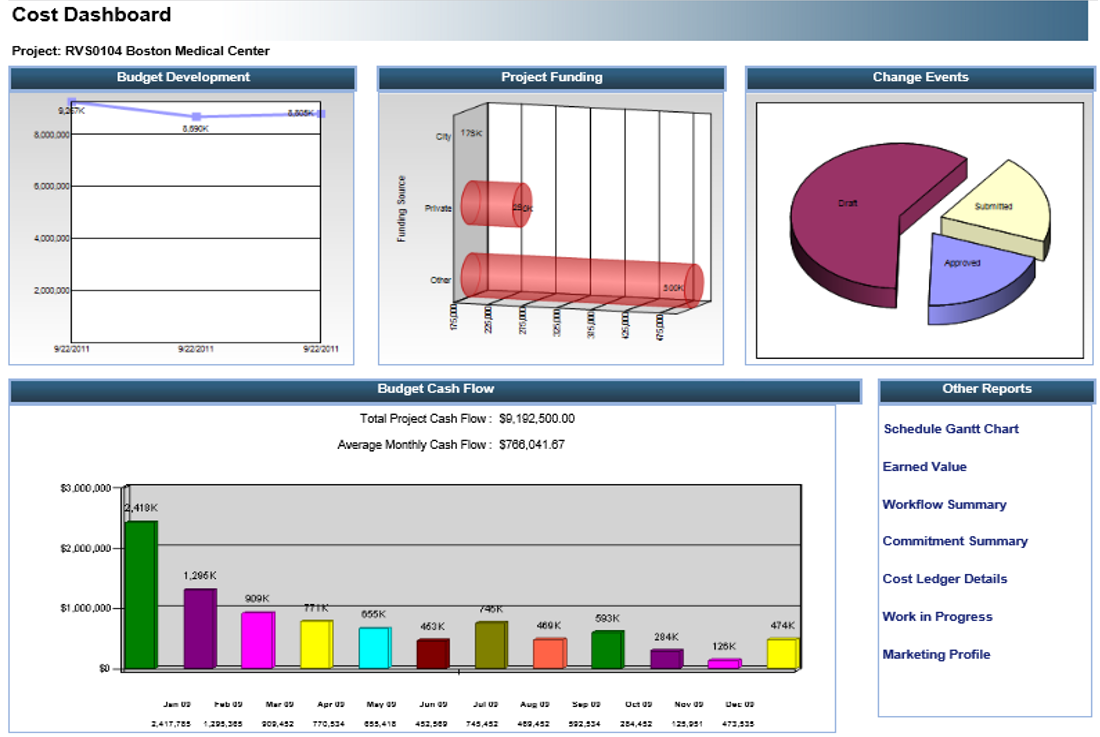
The last dashboard-type will be the project management perspective dashboard, for which there will be different dashboards for cost, schedule, procurement, quality, health and safety, and risk. Those dashboards are of interest to department heads who are keen to understand better how each project, program, or portfolio of projects performs from a specific perspective. Each dashboard’s content would differ depending on the nature of the project management information to be reported on. For example, the cost dashboard will focus on the project budget, budget spending projection, budget adjustments, awarded contracts, change orders, invoices, and payments, among others.
What is important to note that the information shared across all of those dashboards are based on the same PMWeb data source. The dashboards can also be configured to allow the reader to drill down to view more details on the reported information to the extent to be able to reach the specific transaction that was the basis for the reported information.
This trust-worthiness in reporting the projects and programs’ performance information will help build the needed trust with the executive sponsors that will enable securing their support for delivering projects. The lack of sharing real-time trustworthy projects’ performance information will damage the relationship with the executive sponsor. They will feel that they had been excluded and not an essential player for its success. Those dashboards will help to make executive sponsors become part of the projects’ delivery and for which their support is needed to ensure success when it comes to delivering those projects.
