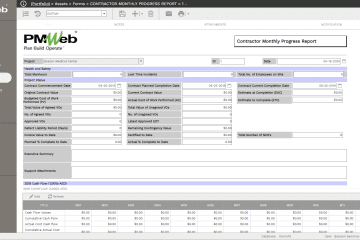
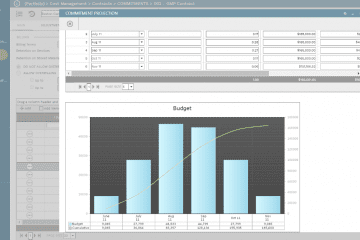
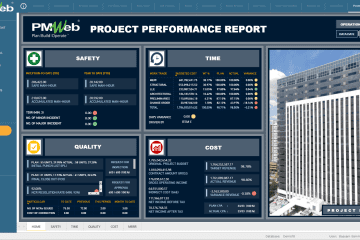
It is a must requirement for every capital project, regardless of its size, type, or location, to have a periodical progress report to monitor, evaluate, and report its status and performance. The progress report usually has a dashboard format. It will include a summary of the project’s schedule, cost, quality, safety, risk, issues, procurement, progress narrative, progress photos, and other areas needed to provide insight into how the project performs. For many organizations, the sources of data used to create those reports are still manually captured and shared using MS Excel spreadsheets. This creates the 80-20 rule.
Although project control team members spend no real studies on time in capturing, cleaning, organizing, associating, blending, preparing, and aggregating the many spreadsheets used to capture the data from the hundred-plus project management processes, nevertheless it is assumed that the 80-20 rule applies. This means it consumes as much as 80% of the effort needed to prepare those performance progress reports while the remaining 20% will be to assess, analyze, visualize, respond, share and present the outcomes of the captured data.
Using project management information systems (PMIS) like PMWeb, organizations can quickly reverse the wasted effort of the 80-20 rule, spending 80% of their effort predicting the impact of what has happened on the project’s future objectives and taking the actions to respond to those threats. A PMIS will enable automating the different project management processes needed to promote the best practices of lean construction management, trust-worthy data capturing, collaboration, transparency, and accountability. This will provide the organization stakeholders with the data source needed for a single real-time version of the truth performance status and pending issues on their complete projects’ portfolio, thus providing the necessary information to have the knowledge and the insight to make better and faster-informed decisions.
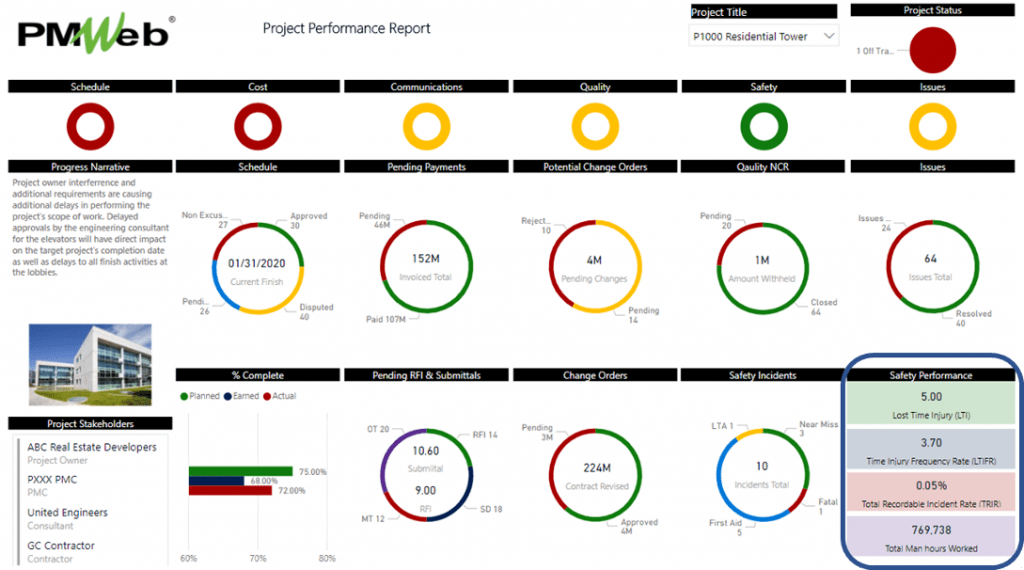
To show how PMWeb can reverse the wasted effort in preparing the data for the project’s performance dashboard, the reported safety performance measures that are part of the project’s performance dashboard will be used as an example. Today, one would rarely find a construction project performance dashboard, whether it is prepared for the project owner, project management consultant, engineering supervision consultant, or contractor that will not include the safety measures of Lost Time Injury (LTI), Lost Time Injury Frequency Rate (LTIFR), Total Recordable Incident Rate (TRIR) and the total working hours worked on-site which is needed to calculate those measures.
Similarly, you would never find a construction site that does not require contractors to submit their daily reports or report safety incidents when they occur. PMWeb Daily Report and Safety Incident default modules will be used to provide the auditable real-time data needed to calculate those four measures. The PMWeb daily report will be used by each foreman or site engineer to capture the details of the weather condition, completed quantities of works by location and the details of the working hours as well as equipment hours spent in performing the results that he or she responsible for along with the relevant project schedule activities that those resources were spent against. This will also include attaching progress photos and other supportive documents when needed.
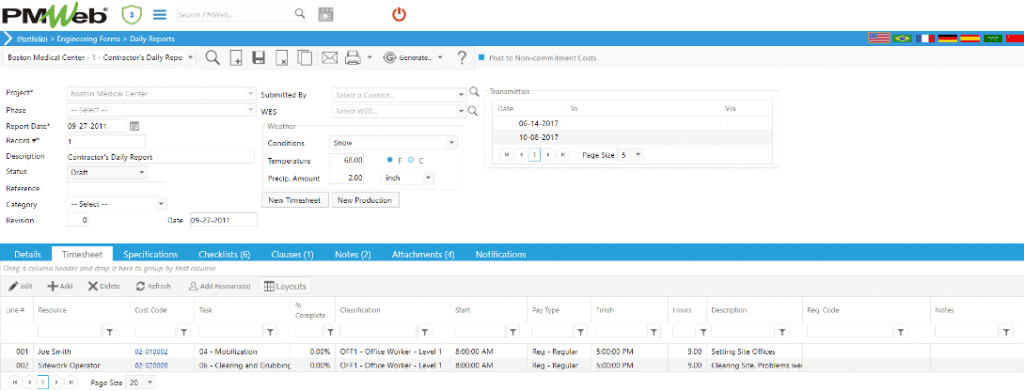
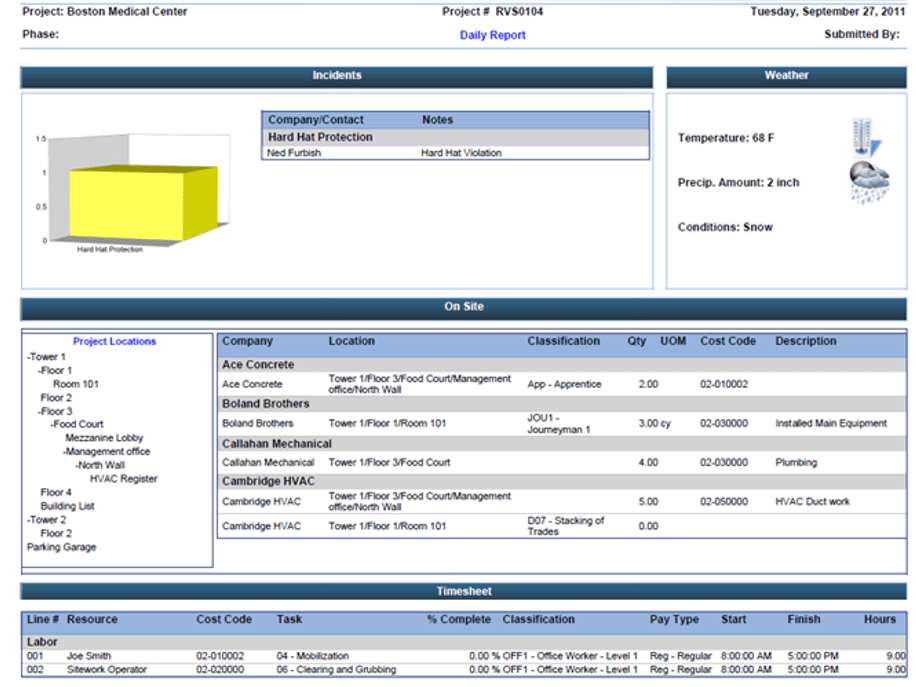
At the end of each day, the data captured in those daily reports submitted by each foreperson or site engineer will be aggregated and presented in the consolidated daily report output form formally introduced to the project owner. The daily report output will be designed in the desired layout and format as required by the project management plan. The daily report will be the only data source used to calculate the total actual working hours spent on site for the reporting period and the total project duration. Daily reports will not replace time attendance systems that the contractor will usually deploy on the construction site.
Similarly, the safety incident module will be used by the safety officer to record all safety incidents that could happen on the project. The form has fields to capture the details of the date, time, and location of the incident, work activity in progress at the time of the incident, description of the incident, people involved in the incident, causes, witnesses, among many others.
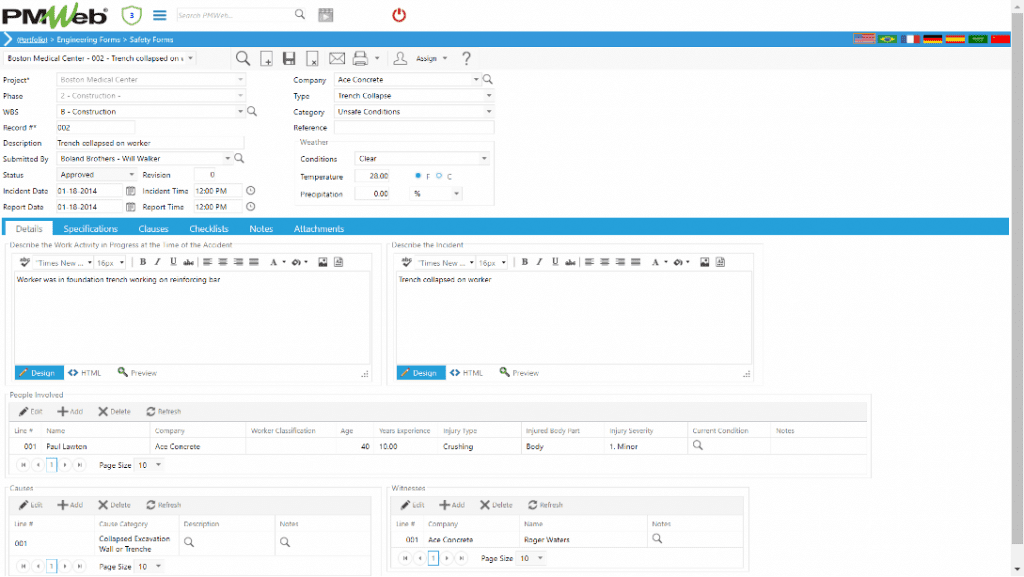
The safety incident form will be the basis for calculating the Lost Time Injury (LTI), which along with the total staff hours calculated from the daily report module, will be used to figure the Lost Time Injury Frequency Rate (LTIFR) and Total Recordable Incident Rate (TRIR).
- LTIFR = (Number of LTI in the reporting period x 1,000,000) / (Total hours worked in the reporting period)
- TRIR = (Number of LTI x 200,000) / (Total number of hours worked in a year)
What is essential in having those safety-related metrics calculated automatically from those two PMWeb forms is that the organization can now automatically have the safety performance trends for each project as well as benchmark the safety performance of each project with the reported safety performance of other current projects, past projects or targets set by the organization.
The amount of effort saved by reversing the 80-20 rule of wasted effort in capturing, cleaning, organizing, associating, blending, preparing, and aggregating the many spreadsheets used to capture the data for the project management processes needed for the project performance report is massive. Nevertheless, the organization’s benefits are not limited to the eliminated wasted effort but also extend to ensuring that the organization has trust-worthy real-time data that is auditable and traceable across their complete projects’ portfolio. The benefits will further include improved transparency, accountability, and insight for better and faster-informed decisions. Services that would eventually lead to enhanced project governance and lean construction management.
