The demand of predicting future results based on current performance and actions has been always a requirement when it comes to delivering capital construction projects. Entities are always keen to know whether their projects’ cost at completion will exceed what they have budgeted for as well as whether their projects’ actual completion date will exceed what they have planned for. The answer to those two questions will usually determine whether a capital construction project was a success or a failure.
Nevertheless, to have a meaningful and reliable prediction of those future results, those entities need to have relevant, accurate, and volume of historical data that can be used to train a machine on how to learn predicting future results. The data needs to be relevant to the projects undertaken by each entity. By definition, projects are unique and one should expect the same would apply to the data associated with those projects. Using other entities’ data, who could be located in different parts of the world and who might have different approaches, risks, and issues when delivering projects, might not give the trustworthy prediction that an entity is seeking to have.
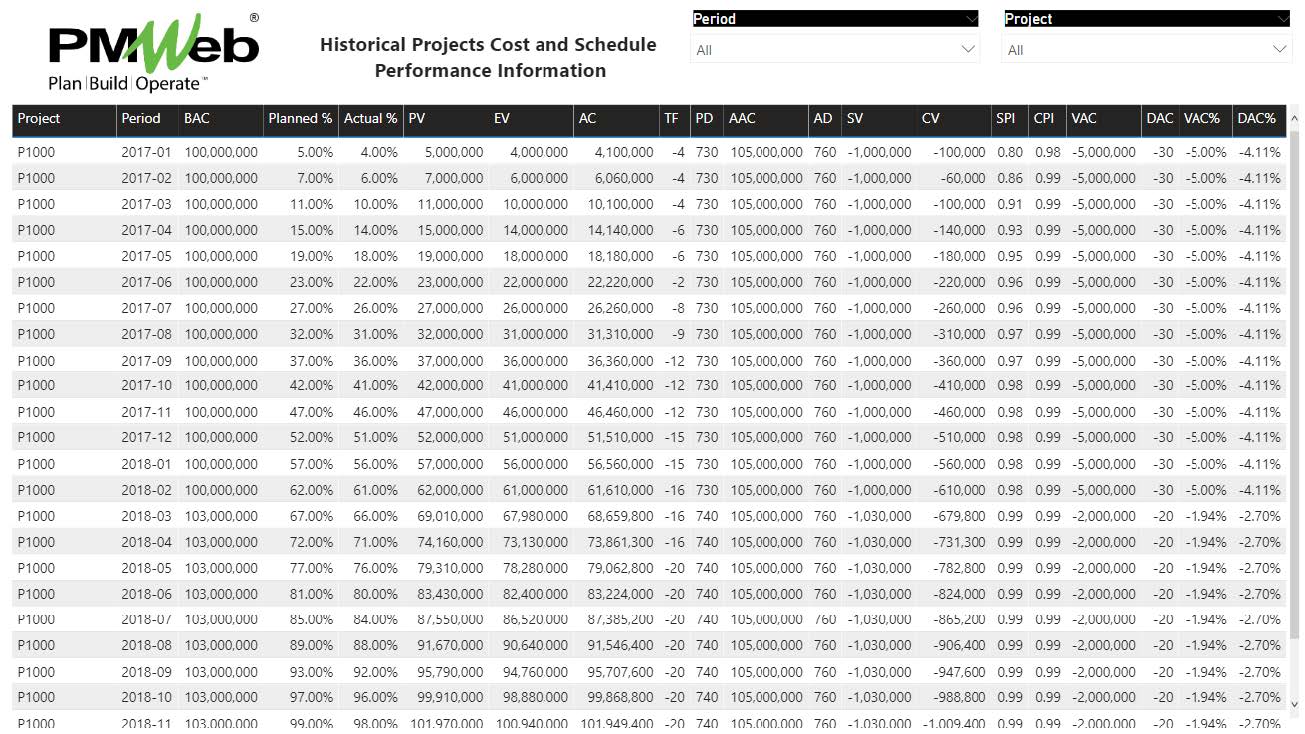
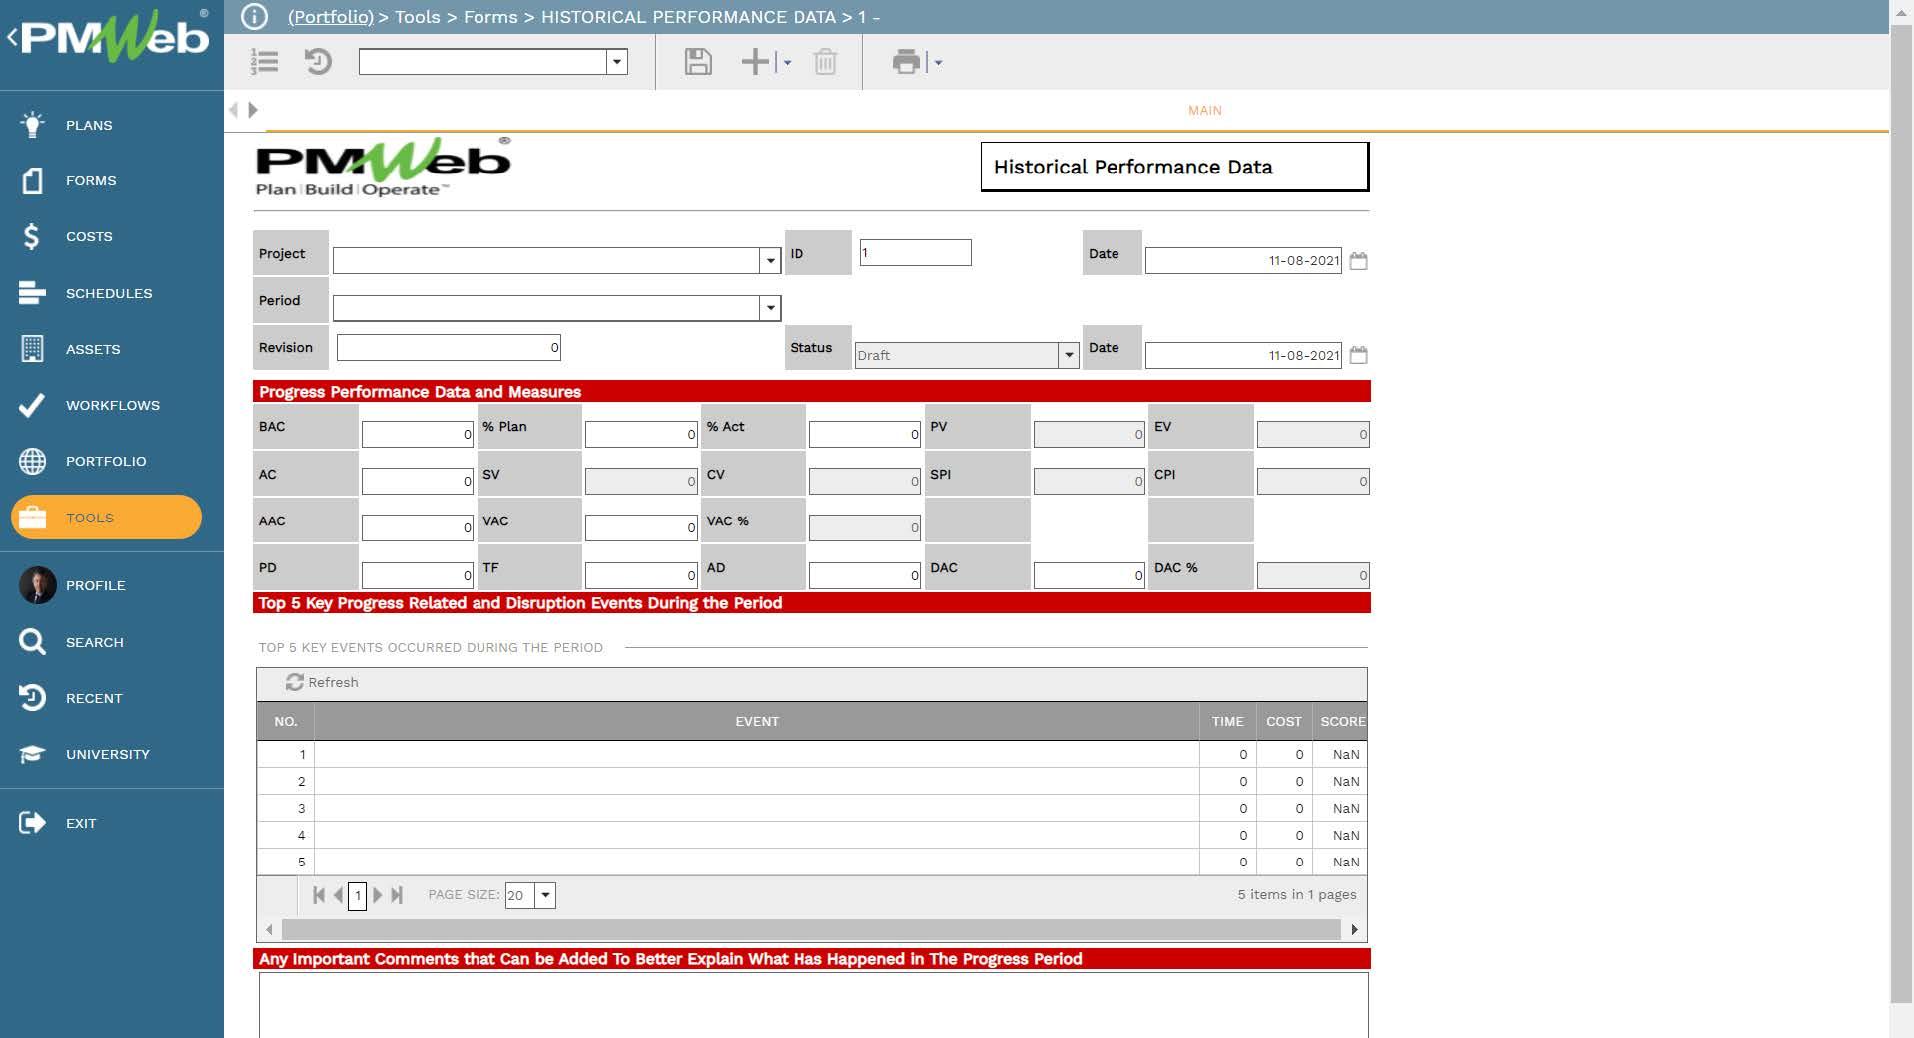
To overcome this challenge, those entities need to use the actual data of their past projects to build the different data sets needed to train a machine. As a minimum, there should be a dataset that will capture the cost and schedule progress status at each period for each project duration including what was the actual cost at completion and duration for the project. For each period, the dataset will include the data fields for Budget at Completion (BAC), Schedule Planned and Actual Percent Complete which will be also used to calculate Planned Value (PV) and Earned Value (EV), Actual Cost (AC), Total Float, Project Planned Duration, Project Actual Cost when it was completed and the Actual Duration it took to complete the project.
This historical projects’ schedule and cost performance data will be used to calculate the measures for Schedule Variance (SV), Cost Variance (CV), Schedule Performance Index (SPI), Cost Performance Index (CPI), Cost Variance at Completion (VAC), Duration Variance at Completion (DAD), Cost Variance at Completion % (VAC%) and Duration Variance at Completion % (DAD%). The next step is to enrich each performance period with the knowledge that explains what has actually occurred during that period and how this could have had an impact on the achieved progress. Details of events that have disrupted performance during a period must be recorded. In addition, progress photos and all other documents that can help to visualize the reported progress, disruption events need to link to their relevant project period.
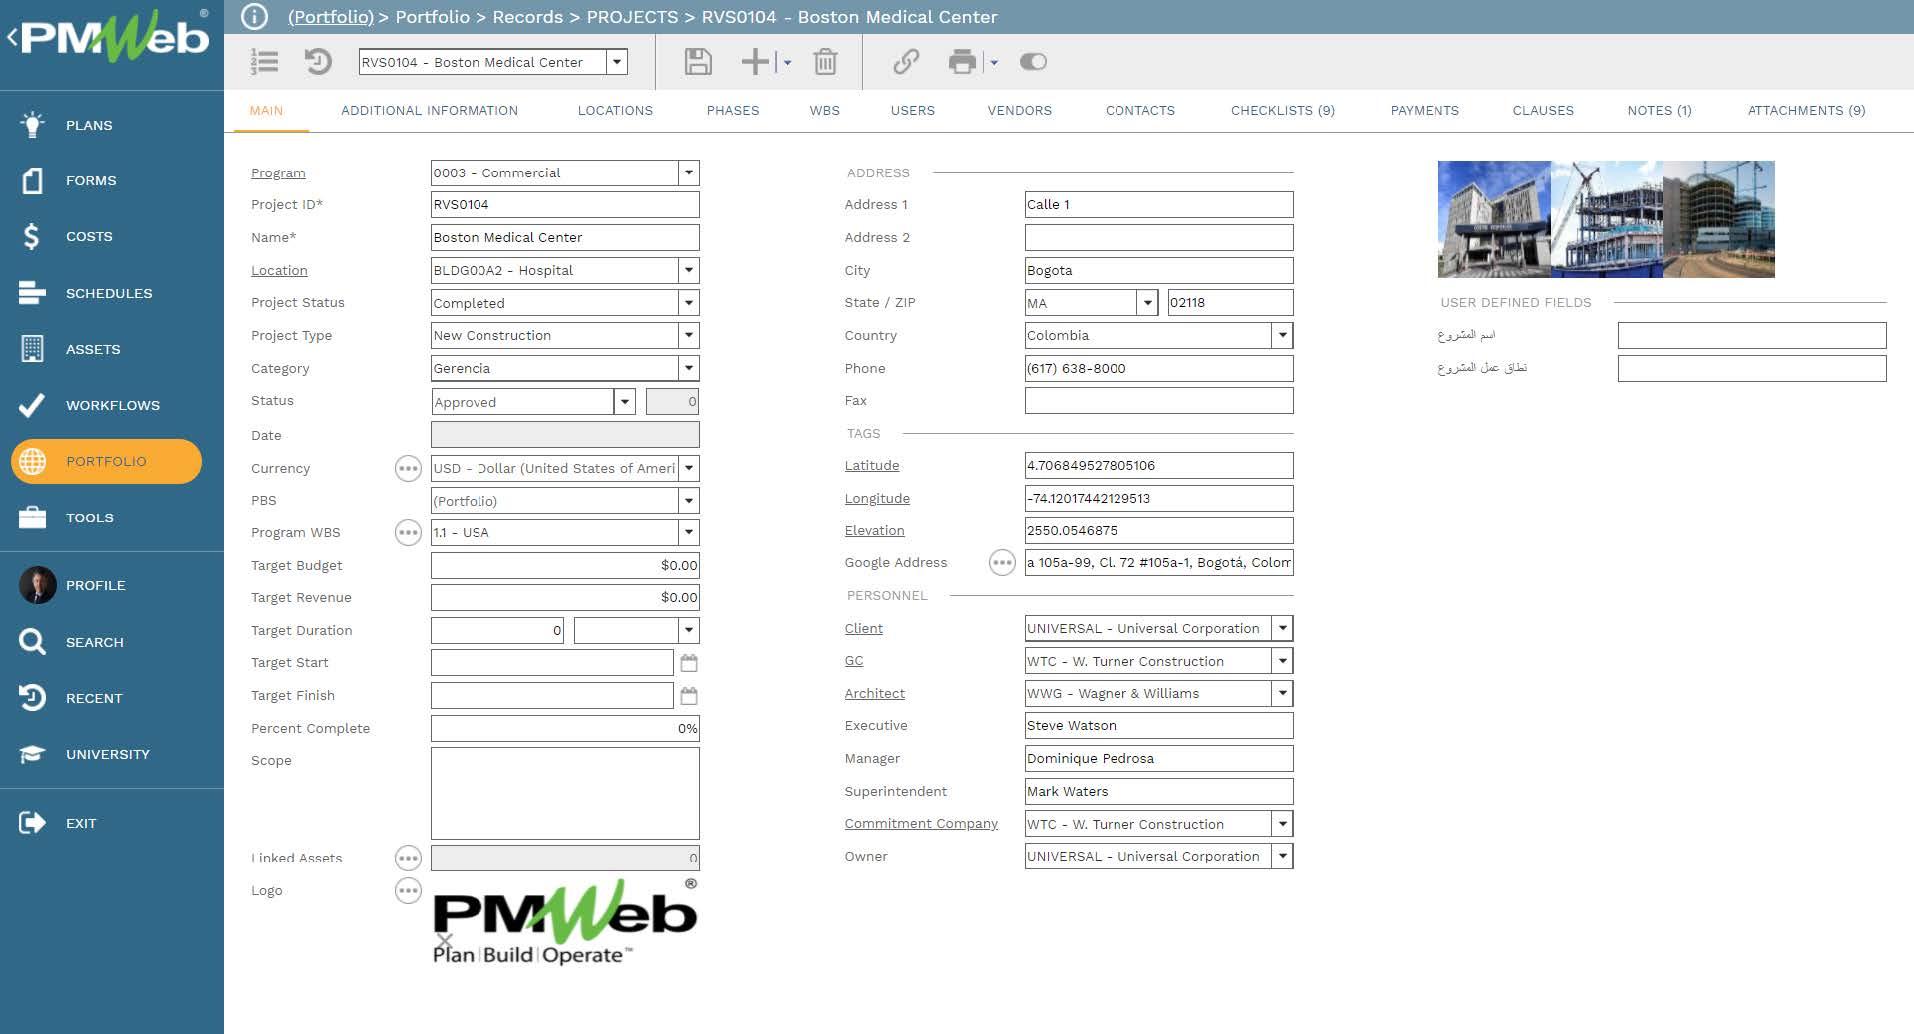
Using a Project Management Information System (PMIS) like PMWeb, the progress and performance history of each project that an entity has access to can be captured. To start with, all projects that progress and performance data can be captured for will be added to the PMWeb projects’ module. It is very important to capture all relevant information for each one of those projects. This will include data for type, complexity, project delivery method, contract agreement type, planned start, and completion dates, geospatial location, project owner, consultant, contractor, built-up area, number of floors, etc. There is no limit to the number of user-defined data fields that can be added to PMWeb templates to capture the required data.
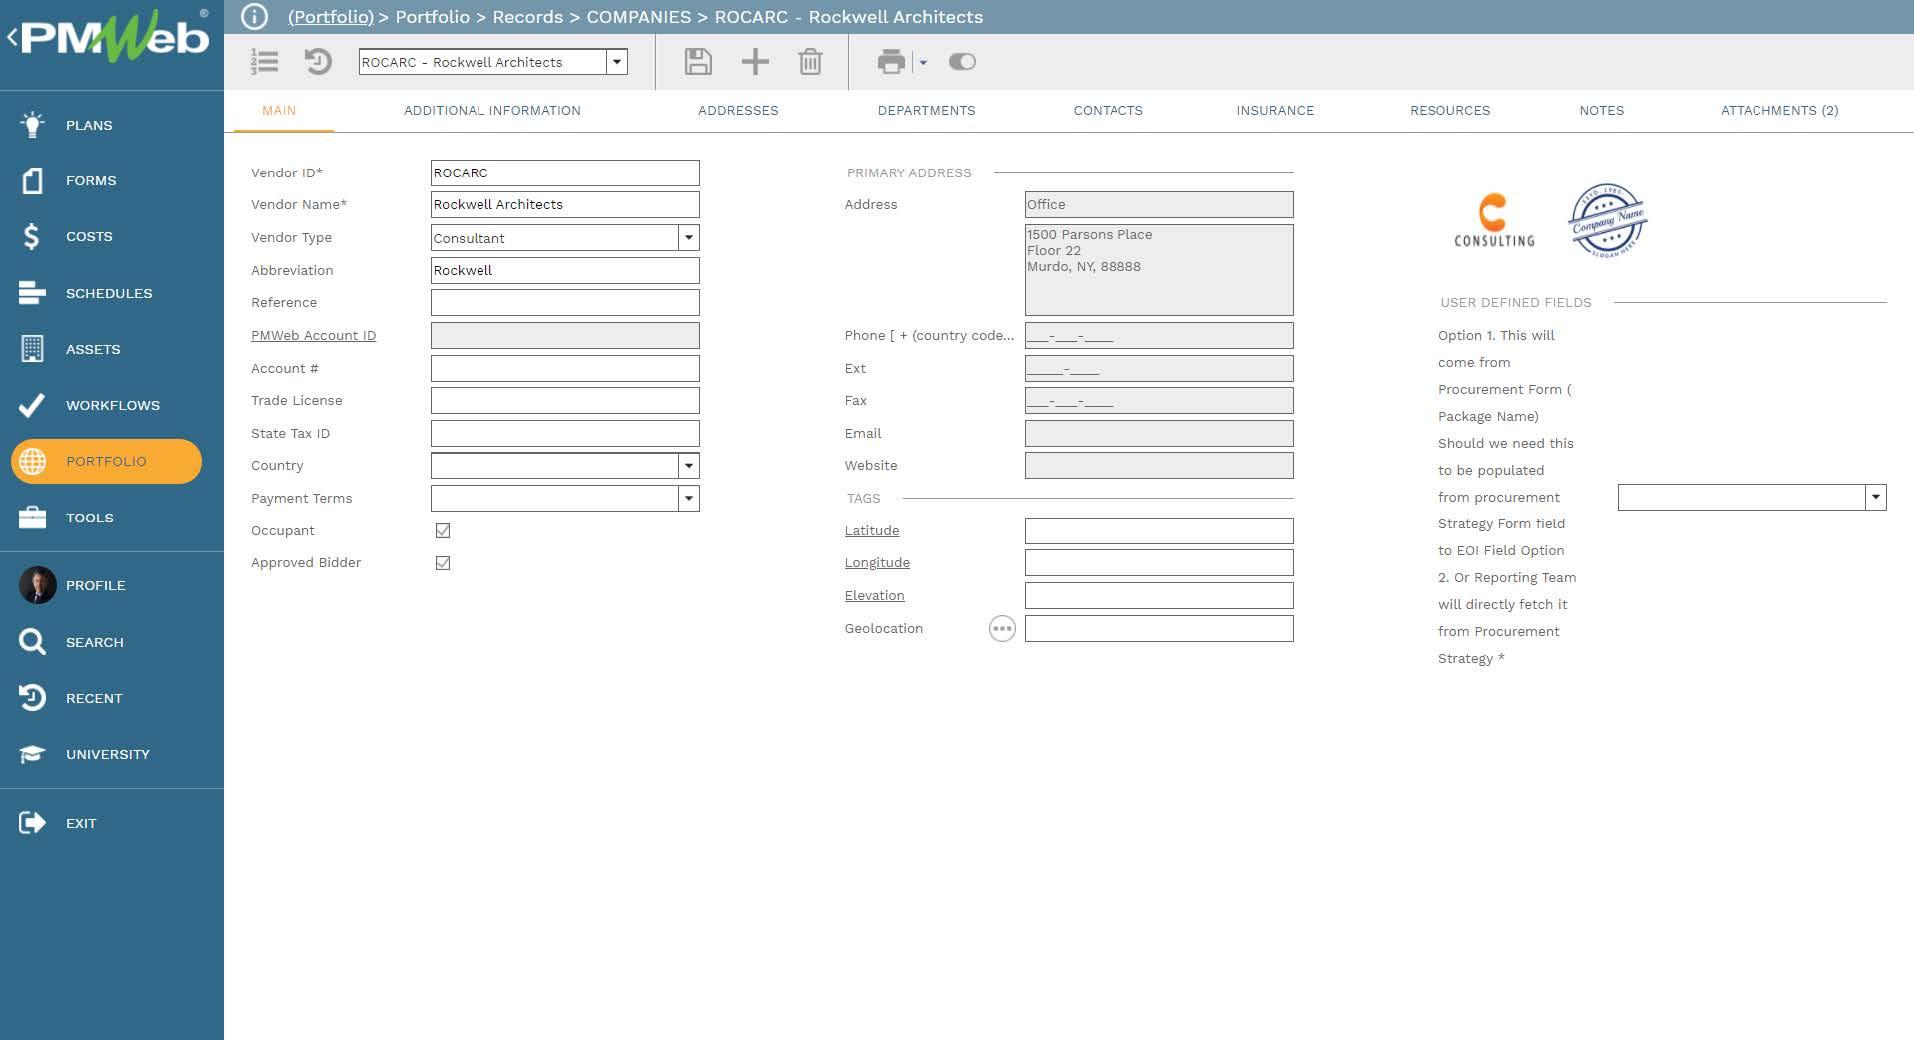
It is also important to capture the details of the entities who had a role in delivering each project as well as details of individuals who could have had a key role in managing the execution of those projects. The contacts details of those individuals are of great importance as they might be interviewed to provide insight into what has happened during those progress periods. PMWeb companies’ module will be used to capture all of those details.
To capture the historical progress and performance data for each period, a PMWeb custom form builder will be used to create the template. The form will include all of the fields needed to report the cost and schedule the performance period. For calculated fields, formulas will be embedded in the template. In addition, the template will include a table to capture the top five keys events that could have disrupted the progress during each period. For each event, there will be a need to score it on a scale of five for the time and cost impact that the event could have had on the period’s progress. The scoring values will be “1” for very low and “5” for very high. Those values will be used to calculate the overall impact score of the event which could range from “1” for negligible impact to “25” for catastrophic impact. Finally, the template will include a text field to add any comments that could be of importance to explain what has happened during the progress period. This progress data could be added manually for each period or be uploaded in bulk into PMWeb from the backend.
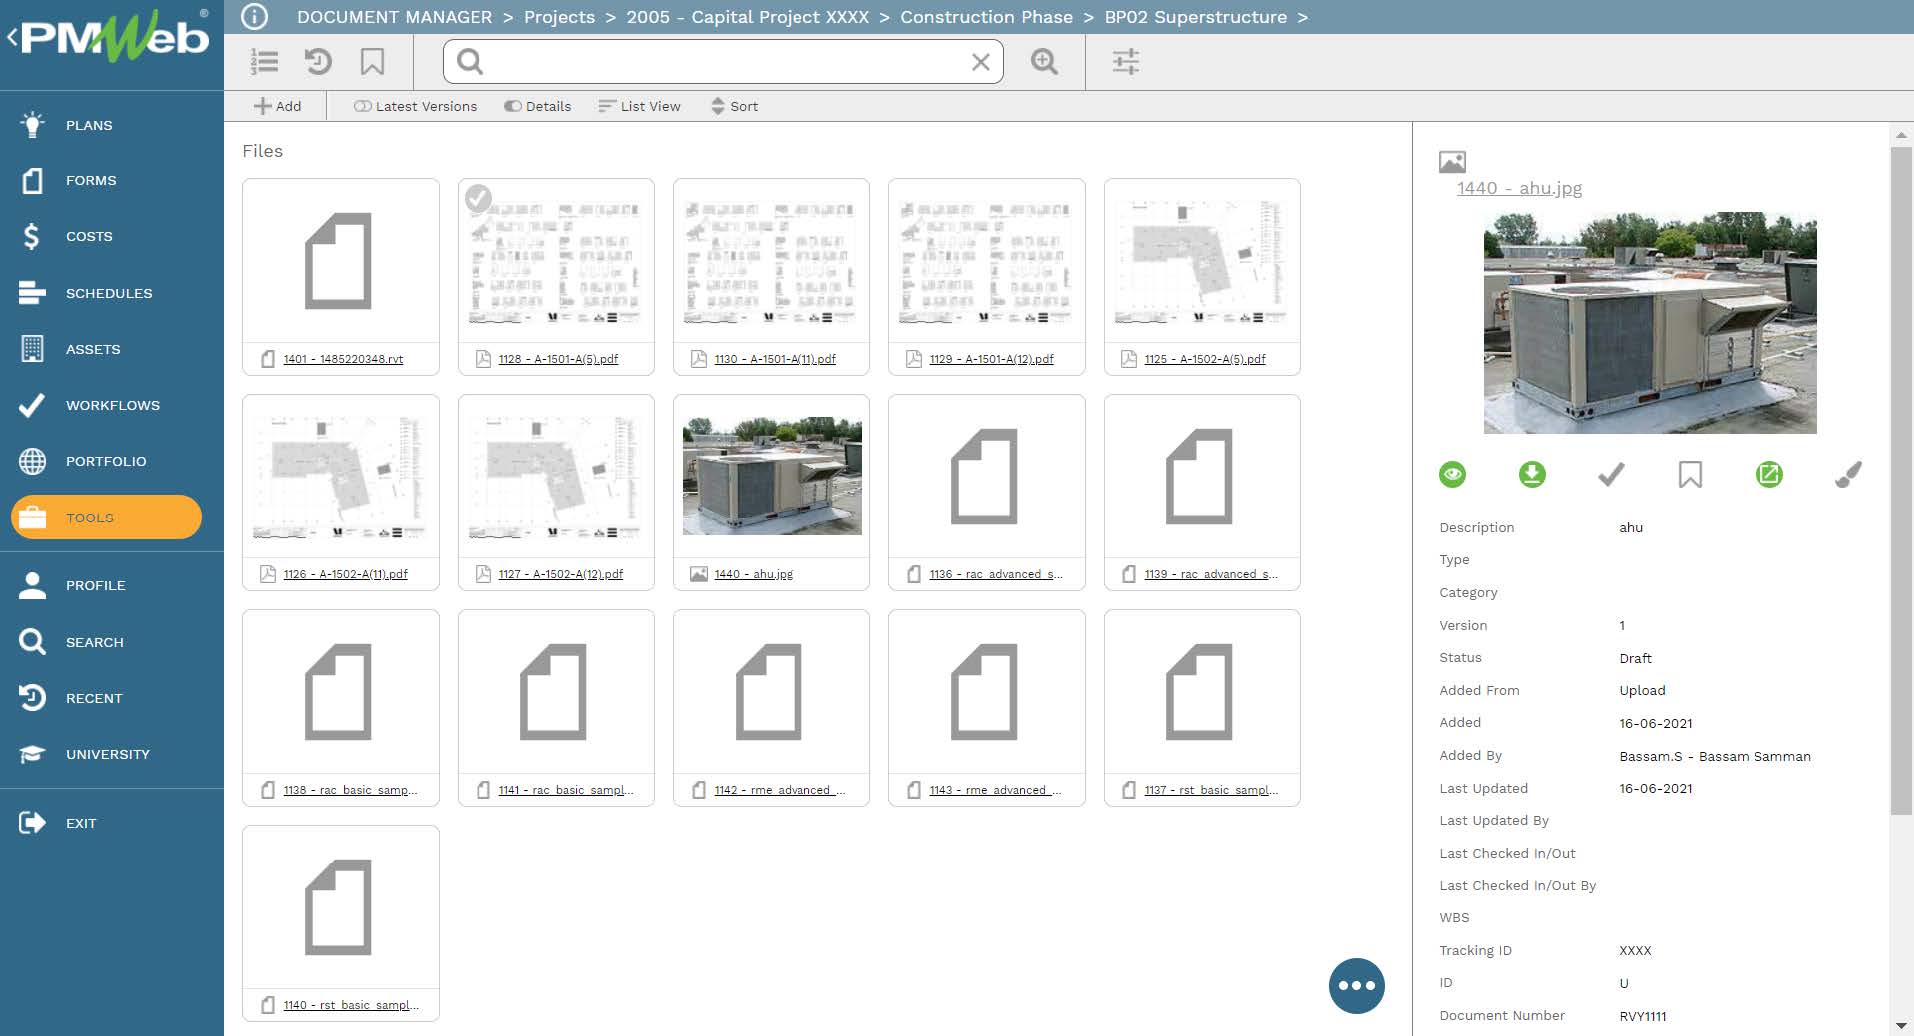
For each progress period, it is important to attach any document that could support the reported progress. Those documents could include pictures, videos, interim progress invoices, non-compliance reports, and other types of relevant project records or documents. It is also highly recommended to add comments to each attached document to provide a better understanding of what was the document for.
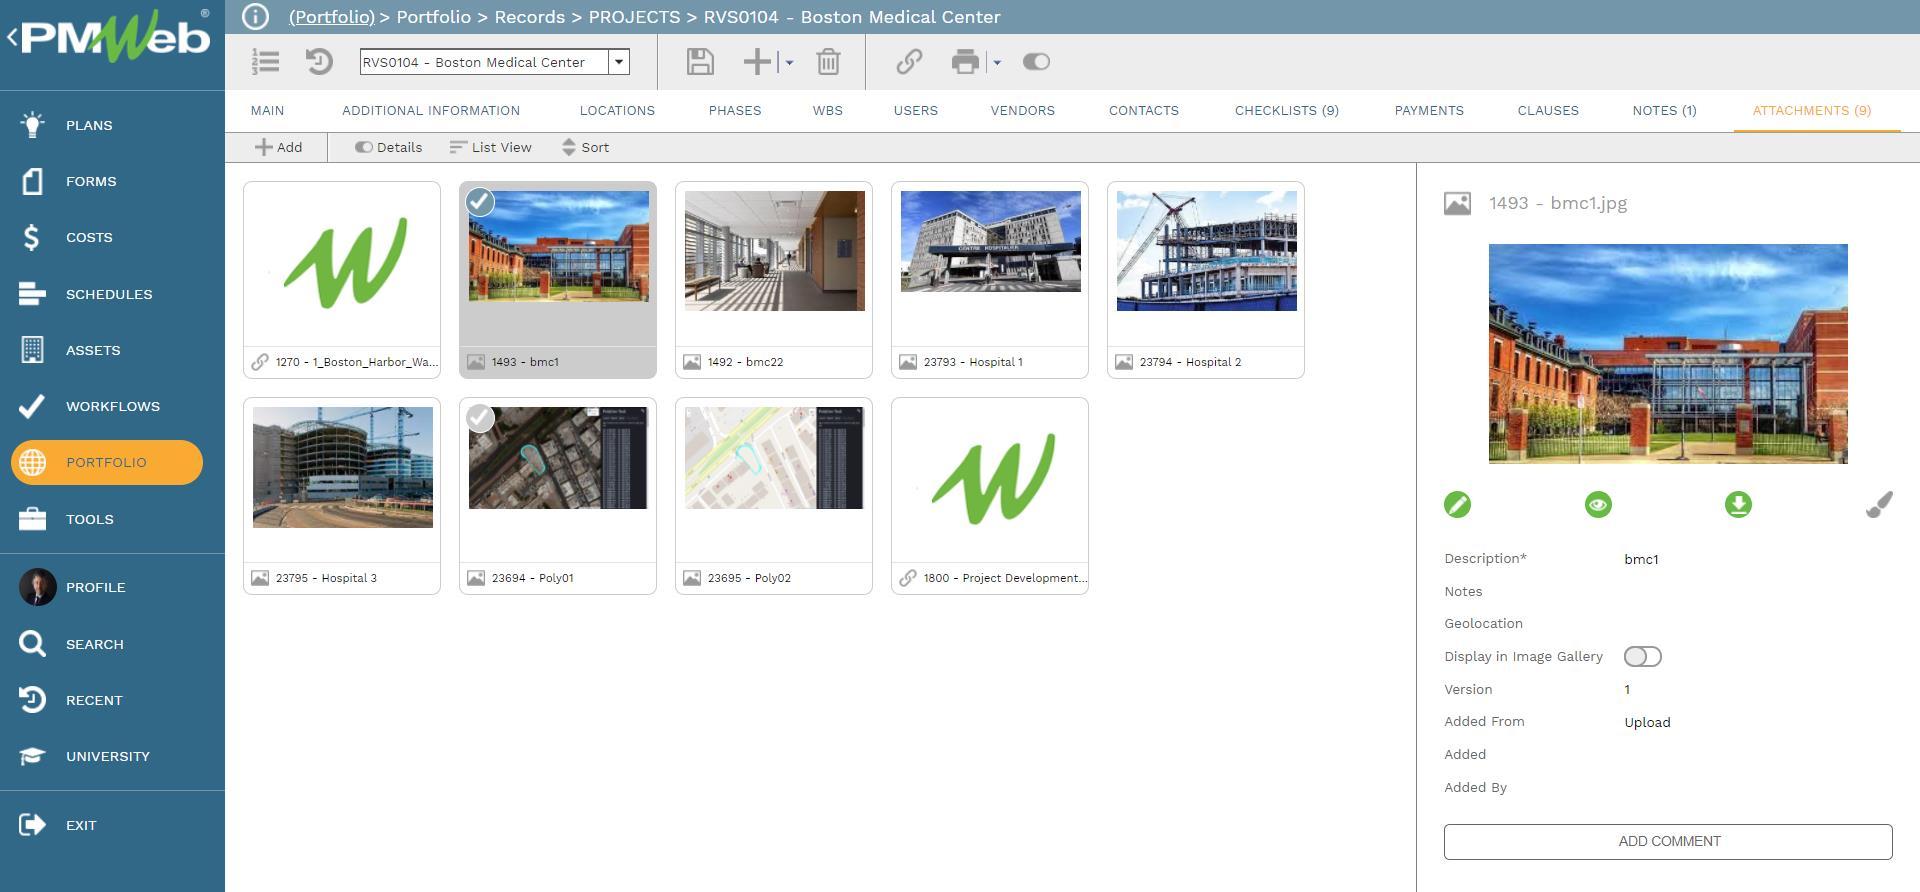
Similar to the progress data that will be captured and stored in the PMWeb database, all supportive documents need also to be uploaded into the PMWeb document management repository so they can be stored and used. Those documents could be uploaded into folders or subfolders so they are better organized and secured. PMWeb allows setting access rights to each folder to identify the users who have access rights to view documents stored in a folder. In addition, PMWeb allows setting notifications for individuals to receive emails when new documents are uploaded or existing documents were downloaded or deleted.
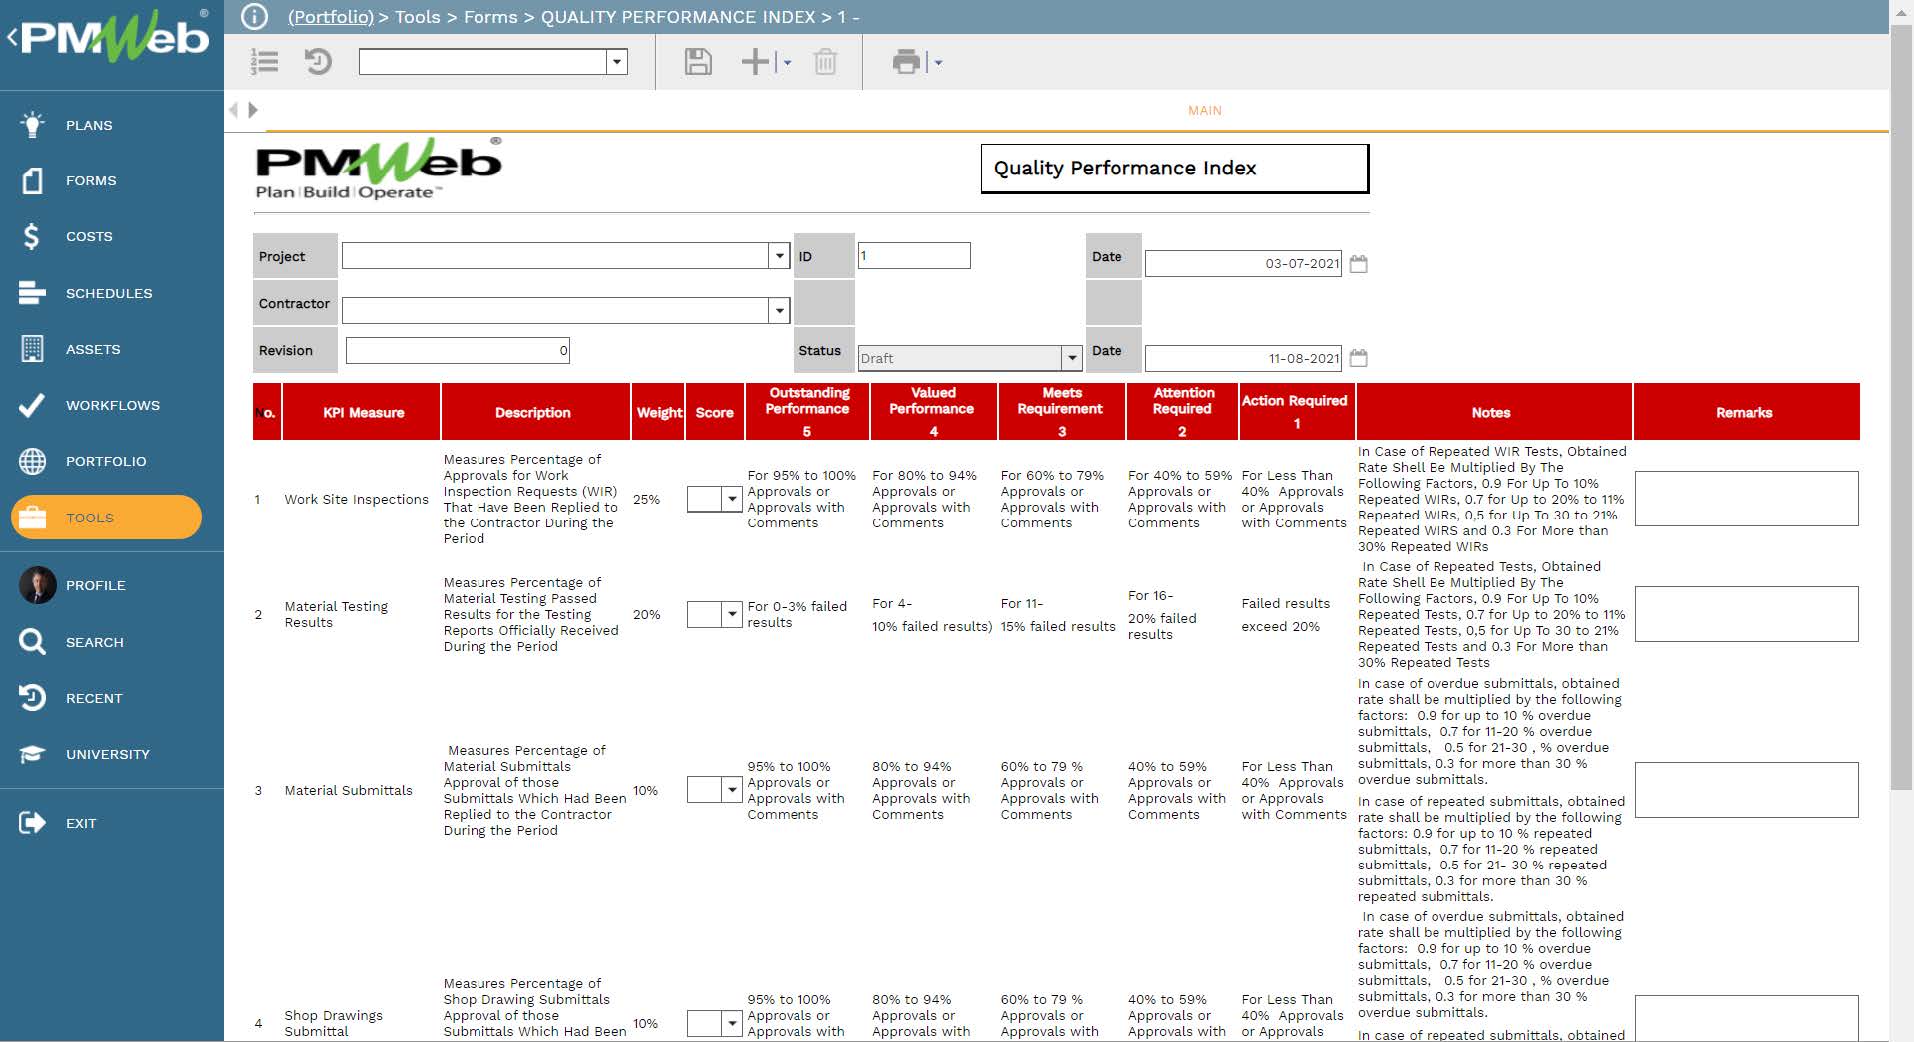
The captured progress data can be further enriched with other data that can better describe what happened on the project during each period. For example, a template can be created to capture the performance measures that relate to quality management. Those could include Non-Compliance Reports (NCR), Request for Information (RFI), technical submittals, Work inspection Requests (WIR) among others. Another template can be created to capture the performance measures for Health, Safety, and Environment (HSE) and other management aspects of the project.
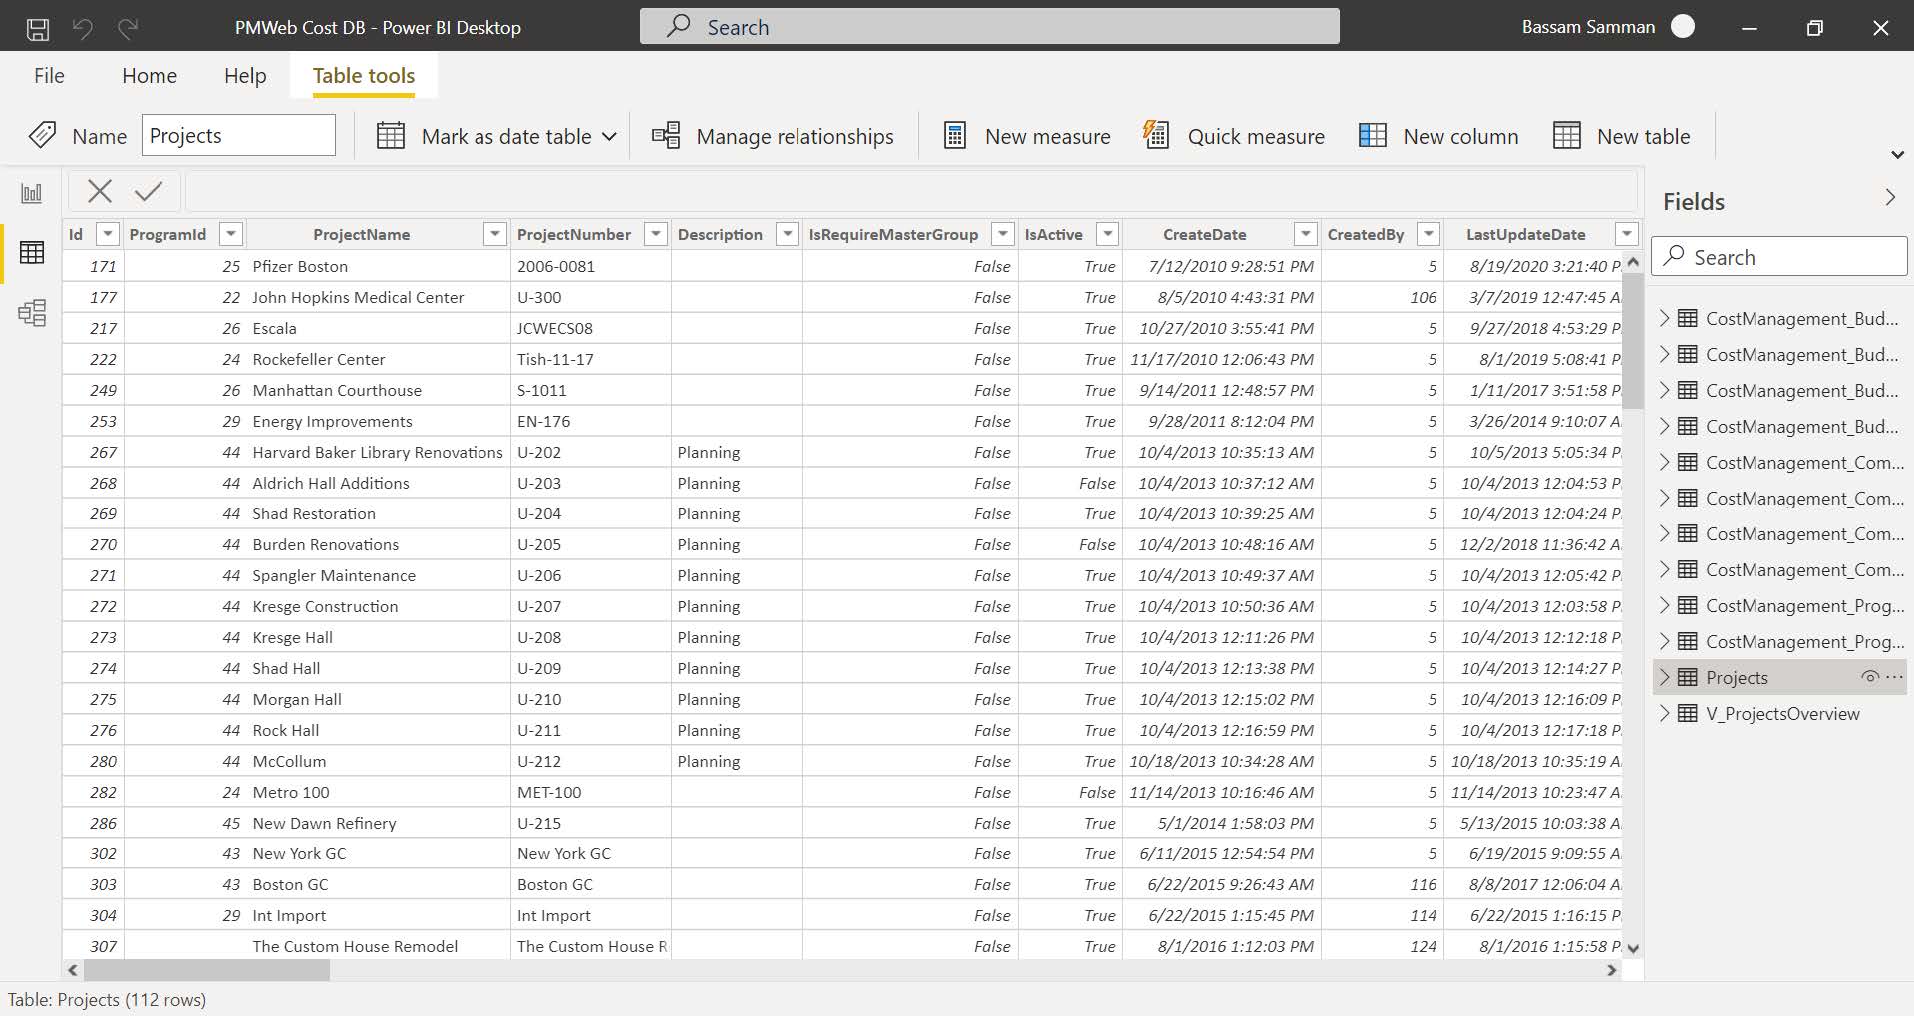
The captured PMWeb progress data and associated documents will then become available to be extracted and used to train the machine learning platform so they can be used by Artificial Intelligence (AI) applications to provide better prediction of future results from current projects’ performance data. This data and associated documents can be also queried using applications like MS Power BI to enable visualizing, analyzing, reporting, and identifying trends that need to be studied and reviewed.
