One of the key requirements when it comes to delivering capital construction projects is how to have a trust-worthy, auditable, real-time, single version of the truth monitoring, evaluating, and reporting the resources and cost performance that is closely aligned to what was planned for when the project was approved for execution. This is needed to have an objective insight into whether the planned project outcomes were comprehensive, realistic, and achievable. The issue with project execution plans is that they could be influenced by the team assigned to develop the plan and other project stakeholders. A project execution plan is usually categorized as a most-likely or realistic plan, conservative or pessimistic plan, aggressive or optimistic plan, or simply to-please or political plan.
Developing realistic and comprehensive project planned project outcomes requires following the best practices of project management. This starts with developing a Work Breakdown Structure (WBS) to decompose the project’s scope of work and an Organization Breakdown Structure (OBS) to identify the accountability for delivering the scope of work defined in the WBS. This will identify the control accounts where work scope, schedule, resources, and cost are planned and managed. A Cost Breakdown Structure (CBS) will be used to identify those control accounts.

Each control account will be detailed into the activities that will become the basis for having the integrated project schedule. Each activity will be loaded with the labor and equipment resource hours needed to complete the scope of work associated with the activity. The total hours of those resources are also known as Budget Quantity at Completion (BAC) which could be at activity, control account level, WBS level, or project. In addition, each activity will be loaded with the allocated cost, schedule of value, or budget cost. The cost of an activity is also known as Budget Cost at Completion (BAC) which could be at activity, control account level, WBS level, or project.
The approved baseline integrated project schedule will use the loaded resources and cost information to produce the labor and equipment resources histogram and planned to earn projection of the project value, also known as Planned Value (PV) or Budget Cost of Work Scheduled (BCWS). When the project’s schedule is updated with actual progress, the project schedule will also calculate the Earned Value (EV) or Budget Cost of Work Performed (BCWP) and the Estimate to Complete (ETC) projection for the remaining project duration. The Estimate to Complete (ETC) projection will be based on the variance between the current project integrated schedule Budget Cost at Completion (BAC) and Earned Value (EV) or Budget Cost of Work Performed (BCWP).
The integrated project schedule provides the best tool to plan the future outcomes of capital construction projects including the forecast the labor and equipment resources usage and project value earning. The integrated project schedule is also considered as a formal project document as it will be subject to formal review and approval.

Nevertheless, monitoring, evaluating, and reporting the performance of a project depends on the actual start and finish dates of the project schedule activities, usage of labor and equipment resources, actual earning of planned project value, the actual cost of completing the project’s scope of work among other actual progress information. This actual progress information needs to be formally communicated to be considered as a trustworthy and auditable source of information.
Therefore, a Project Management Information System (PMIS) like PMWeb will be needed to manage and capture the actual progress information from the everyday project activities and events that are captured in the formally communicated project management processes. To achieve this, PMWeb modules for daily reports and timesheets will be used to capture the actual labor and equipment resource hours spent on the project on daily basis.

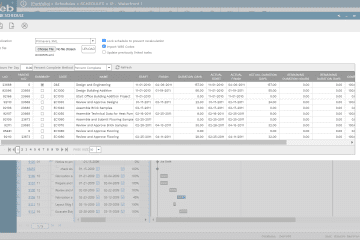
On the other hand, PMWeb modules for the contract, change orders, requisitions, commitments, potential change orders, change orders, and progress invoices will be used to capture the Actual Cost (AC) and potential adjustments to the Estimate to Complete (ETC). Each one of those cost management processes will include all supportive documents that will be attached to the process and a workflow that will be assigned to formalize the submit, review, and approval process as well as enforce the set approval authority levels. The cost details captured in those cost management processes will be automatically stored in the PMWeb cost ledger to become available to be reported on using the PMWeb cost worksheet module. The cost worksheet module allows creating all needed layouts to report on the cost information showing the desired cost data fields. The cost worksheet can be exported to MS Excel file format.

Now the challenge is that we have a great wealth of valuable project or projects data captured in two different data silos that neither one of them can replace the other. The first data source belongs to the Primavera P6 integrated project schedule that will provide the Planned Value (PV) based on the current updated and approved schedule as well as the planned Estimate to Complete (ETC) projection. The project schedule data source is mainly populated by the project’s planners. The second data source is the PMWeb PMIS data source which provides the actual usage of resources as well as all cost data generated from the actual progress to date. The PMWeb data source is populated by the project individuals who are responsible to report on daily site activities, cost management, procurement, and contract management, risk management, quality management, HSE management among many others.
To address this challenge with the least effort and financial investment while fulfilling the requirement for monitoring, evaluating, and reporting the resource and cost performance of capital construction projects, the use of a business intelligence and data visualization tool like MS Power BI will be the desired solution. MS Power BI can read the needed data from the two data sources and associate them with each other by using common fields for both data sources. Those are the fields of project, work breakdown structure (WBS), cost breakdown structure (CBS), and project schedule activity. MS Power BI will be used to create the formulas and measures needed to report the required performance. The captured data in MS Power BI will be configured to be refreshed automatically to ensure that the latest updated date from P6 and PMWeb data sources are being used and reported on.

The information captured in MS Power BI will be used to analyze the planned and actual usage of resources to determine the actually achieved efficiency and productivity rates during the different periods of the project’s duration. Reports can be created to associate reported disruption events with the actual usage of resources to identify the reasons behind low or lost productivity rates. This analysis will also identify the reasons for idle resources and their impact on the total resource hours actually deployed on the project. The extent and depth of resource performance analysis depend on the actual data captured in the PMWeb and how this data relates to the project’s schedule activities and consumed resources.

In addition, MS Power BI will be used for analyzing the project cashflow projection, assessing the project’s profitability and earned value management (EVM) analysis for schedule and cost variances (SV and CV) and schedule and cost performance indices (SPI and CPI). The actual cost data captured from the different PMWeb cost management processes will enable the organization to consume this data and create reports to provide the needed insight to assess the validity of the original cost baseline plan, efficiency in spending the baseline plan, and the reasons that could have impacted the final project cost at completion. Similarly, the extent and depth of cost performance analysis depend on the actual data captured in the PMWeb and how this data relates to the project’s schedule activities and actual cost spent on the project.

The benefits of associating Primavera P6 or any other scheduling tool with PMWeb are not limited to resources and cost performance monitoring, evaluating, and reporting but it can also be used to analyze delays associated with approval delays among others. For example, PMWeb allows associating project schedule activities with time-sensitive processes like a request for information (RFI), technical submittals, and meeting minutes of business items. MS Power BI can be can used to analyze the actual process completion date with the due date and the impacted activity start date for all transactions that relate to those time-sensitive processes or any other project management process that is associated with a project schedule activity. For those processes, the actual process completion date will be usually driven by the workflow assigned to the process. The analysis will help to identify which workflow step could have caused the delay.
Therefore, associating the planned project outcomes as captured in the project’s integrated resource and cost loaded schedule using a tool like Primavera P6 with the actual project results that are formally captured using a Project Management Information System (PMIS) like PMWeb can bring great value when it comes to monitoring, evaluating and reporting the resources and cost performance of capital construction projects.