For those involved in executing linear capital projects such as highways, pipelines, metro, rail, and transmission lines, others usually use TILOS, Turbo-Chart, and others to monitor, evaluate, and report the scheduled quantities of work performed. Nevertheless, having a single version of the truth of the project performance status goes beyond schedule and quantity of work. It needs addressing other project’s success measures, including a budget, adjustments, awarded contracts, approved, pending, and potential changes orders, risks, quality, safety, issues, among the many other aspects of managing capital projects.
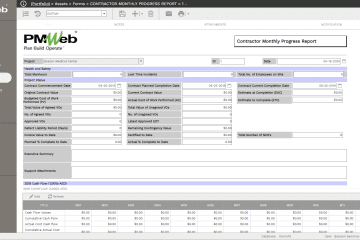
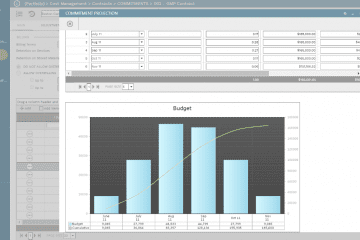
Using Project Management Information Systems (PMIS) like PMWeb, those involved in managing those linear projects can have all of the project management processes managed using the same platform. All those processes will have their input forms, workflows, output forms, and reports to ensure that the right information is captured by the honorable project team member at the right time. Also, all related documents for those processes will be uploaded and stored in the PMWeb document management repository to be attached to their relevant records. In addition, PMWeb can import the project schedule information by default as well as import data from third-party applications that might be integrated with PMWeb.By having all of this data and documents on a single platform, PMWeb business intelligence reporting tool as well as third party data visualization and business intelligence applications like MS Power BI, Tableau, Qlik, among others, can access this trust-worthy auditable data to generate dashboards and reports to communicate the performance status of those projects as well as any other information deemed to be necessary. Those dashboards and reports can be projected or program-specific as well as it can be an enterprise dashboard to report on the different projects’ portfolio that the organization has.
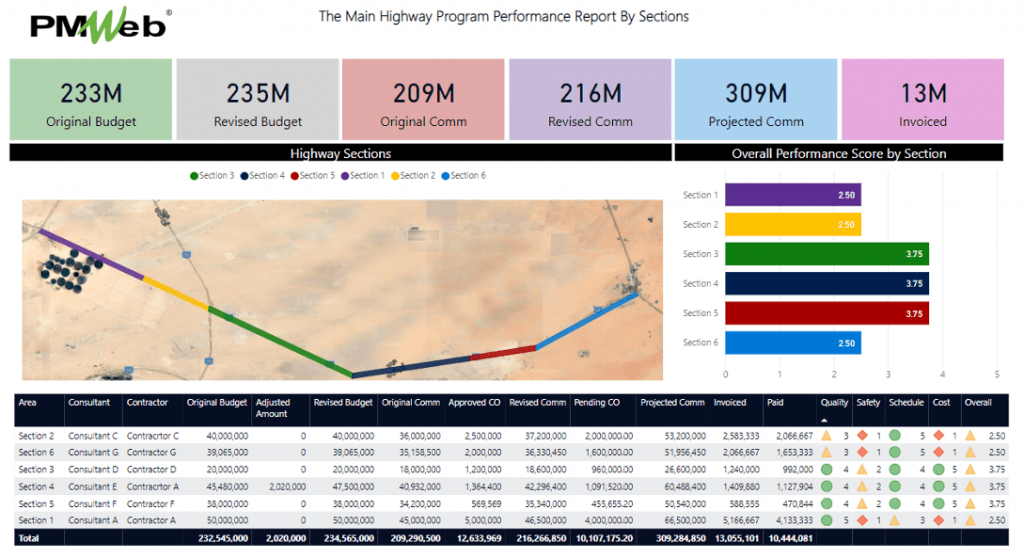
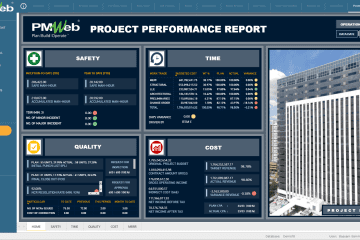
Those dashboards will be designed to enable the stakeholder to drill down to view more information on the selected project. For example, for the program dashboard displayed above, the stakeholder can drill down, either by using the map display or the projects scorecard, to each project dashboard to view more details about the project performance. This could performance details for the current period and the performance trend for the past six months. The project progress report will also include a narrative description of the achieved progress and details of the pending issues that need to be resolved to avoid project delays and cost overrun. The dashboard will also include pictures of the project’s progress.
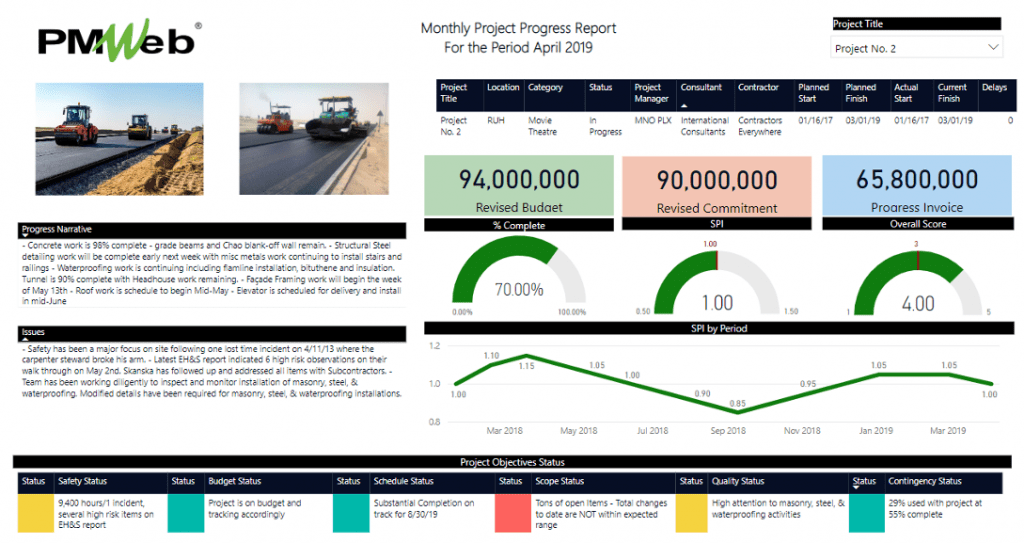
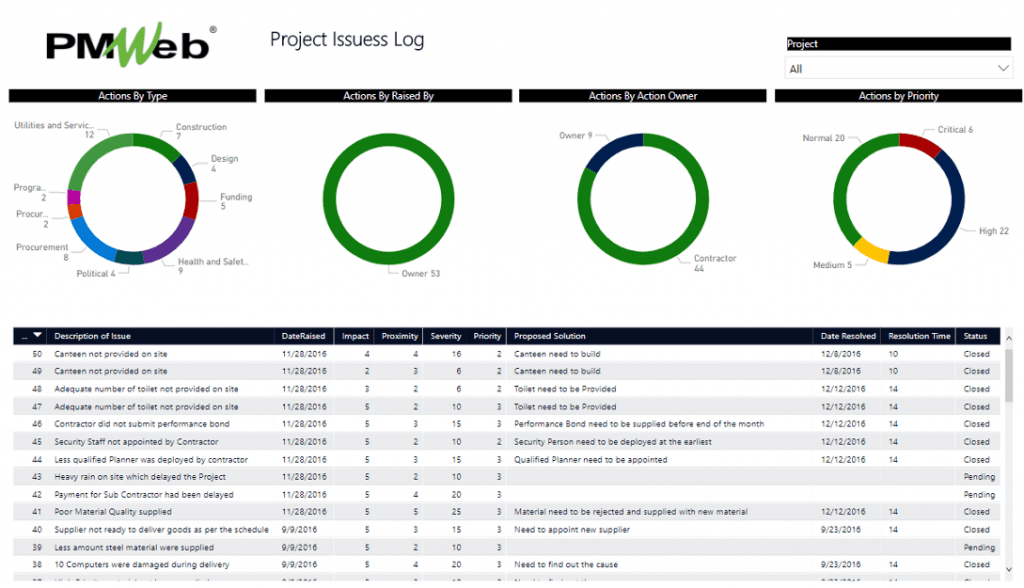
Should the stakeholder require additional detail on the project schedule, budget and cost, quality, health and safety, risks, issues, among others, the project dashboard will be designed to enable the stakeholder to drill down for this information. For example, the stakeholder can drill down to the problems report as this is one of the most important reports that details all issues that must be resolved as soon as possible to mitigate their negative impacts on the project’s objectives.
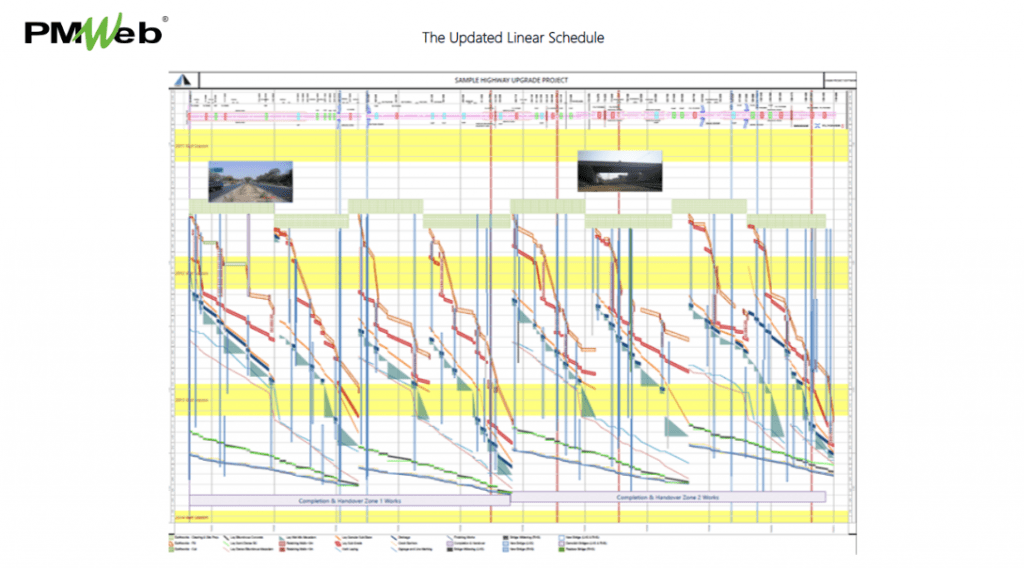
Of course, those who need more details on the project’s schedule performance can view the updated project schedule reports that are saved as PDF printouts of Oracle Primavera or MSP Schedule or as a PDF file of the TILOS or Turbo-Chart linear schedule. Those reports will be uploaded and stored in the PMWeb document management repository and attached to the PMWeb monthly progress form. For the TILOS or Turbo-Chart report, which is usually a one-page report, it can be saved as a picture embedded in one of the dashboard pages. The main objective is for the stakeholder who is keen to monitor, evaluate and report on the projects’ performance, is provided with a single access point to have at any time, anywhere using any device to have access to a 360-degree, real-time single version of the truth of how the project, program or projects’ portfolio are performing.
