On a construction project, regardless of whether the project control system (PCS) was managed by the project owner or contractor, one of the key reporting requirements for a PCS is reporting the current status of the Health, Safety, Security, and Environment (HSSE) key performance indicators (KPI). These include the key performance indicators for Lost-Time Injury (LTI), Lost Time Injury Severity Rate (LTISR), and Lost Time Injury Frequency Rate (LTIFR). These KPIs are considered lagging safety indicators, meaning they provide insight into a project’s elapsed period safety performance, but do not necessarily indicate its future safety performance.
A Lost-Time Injury (LTI) is an event that results in a fatality, permanent disability, or time lost from work. This time could be as short as one day or a whole shift. For each reported LTI event, there is a requirement to specify the number of days of lost time because of the incident. The Lost Time Injury Severity Rate (LTISR) indicates how serious the injuries have been on the construction site to date. The LTISR is defined as the number of days of lost time per one million man-hours worked on the project (LTISR = (No. of Days Lost x 1,000,000)/ Manhours Worked). For example, an LTISR of 10 shows that ten days were lost on a job site every 1 million hours worked.
On the other hand, the Lost Time Injury Frequency Rate (LTIFR) indicates the frequency rate of how many LTI events happened on the construction site to date. The LTIFR is defined as the number of lost-time injuries (LTI) occurring at a workplace per one million hours worked within a given period (LTIFR = (LTI Events x 1,000,000)/Manhours Worked). For example, an LTIFR of seven shows that seven lost time injuries occur every 1 million hours worked on a job site.
The LTI Score is similar to the Risk Score, where it is calculated by multiplying a risk’s occurrence likelihood by its impact. The LTIFR relates to the frequency of an LTI event, which can be considered the occurrence likelihood, whereas the LTIST relates to the severity of an LTI event. This can be regarded as the impact of the LTI. A high LTI score indicates the poor safety environment a project has.
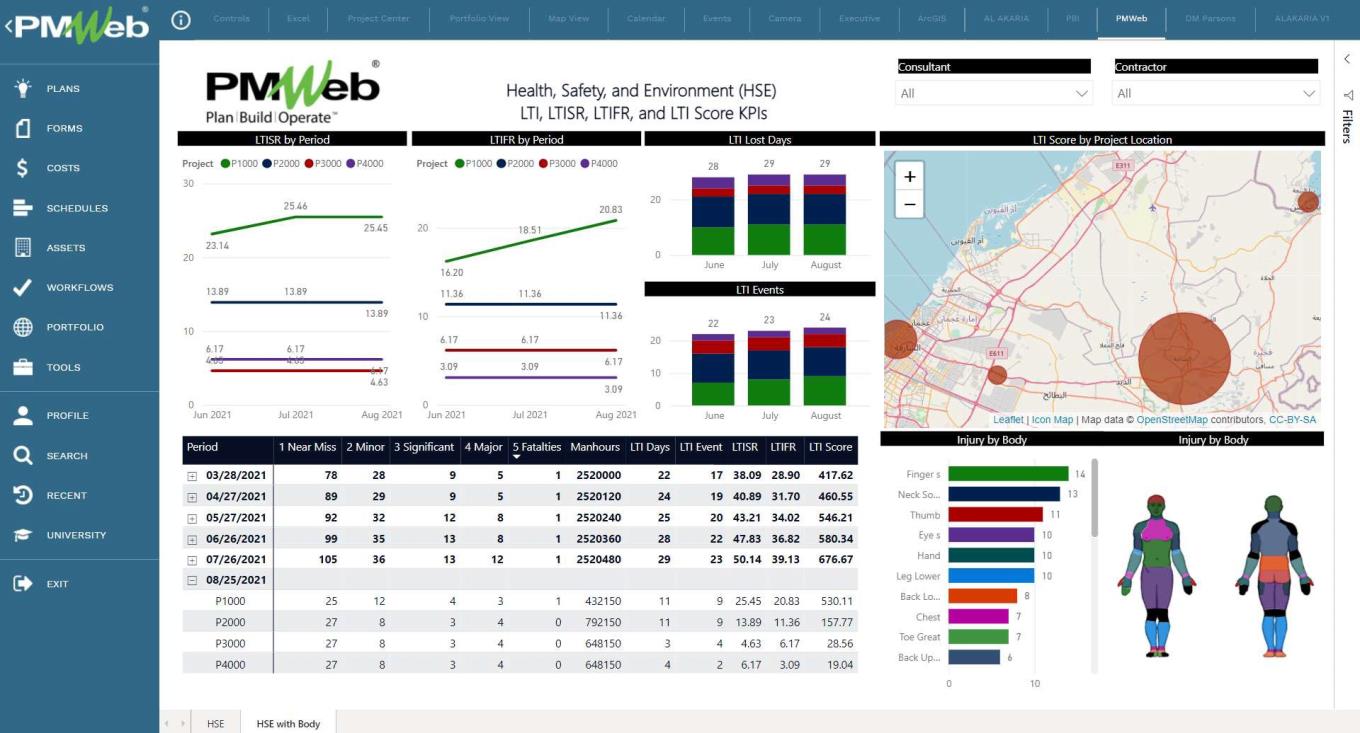
These HSSE KPIs can be reported in different forms and formats. For example, line charts can be used to detail the LTISR and LTIFR performance trends for the last three months period, whereas the LTI events and lost days can be presented using a histogram for the same period. The LTI score for the current period can be shown as a bullet on the map that displays the project’s location. Another chart can be created to indicate the severity of the safety incidents on the projects. In addition, a scorecard can be added to display all data used to calculate the HSSE Key Performance Indicators.
Monitoring, evaluating, and reporting the status of the LTI, LTISR, LTIFR, and LTI Score KPIs require having access to real-time, trustworthy data on the number of LTIs that have happened on the construction site. Data detailing the manhours lost due to the incident and the total number of labor-resource hours spent on the construction site to date are also required. Using PMWeb, these values will be readily available using PMWeb out-of-the-box modules for Daily Reports and Safety Incidents.
The PMWeb daily report module captures and calculates the total number of labor resource manhours spent on the project. This ensures that the resource manhours used to calculate the LTISR and LTIFR are accurate and auditable. The timesheet tab on the daily report module captures the actual labor resource manhours spent on the construction site.

In addition, the PMWeb safety incident module captures the LTI value for which the safety incident template includes details of the safety incident that occurred, including incident date, time, subject, location, and type of safety incident. The template also includes those incidents due to unsafe acts or conditions, motor vehicles, loss of containment, non-work-related fatality, near misses, and other damaging incidents. Each safety incident description also includes the type of cause that resulted in the incident. These, for example, could include slip and fall, structure failure, trench collapse, scaffolding accidents, run-over by operating equipment, roof-related fall, unsafe/faulty ladder, and welding accident, among many others.
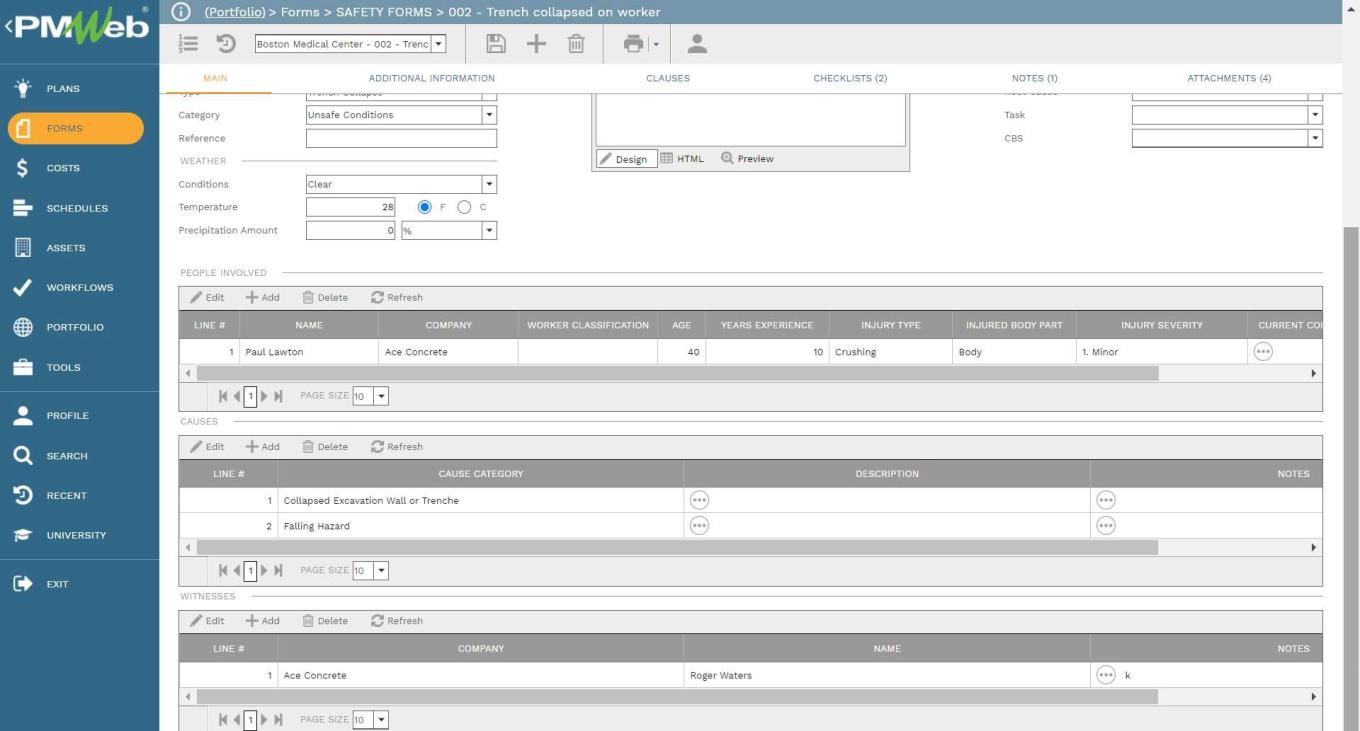
The PMWeb default safety incident form also includes fields for the description of the work activity that was in progress at the time of the accident, a description of the incident, the people involved in the incident, including their injury type, injured body part, injury severity, and lost working hours due to the incident. The safety incident form also includes a section to detail the causes of the safety incident and the witnesses of the incident.
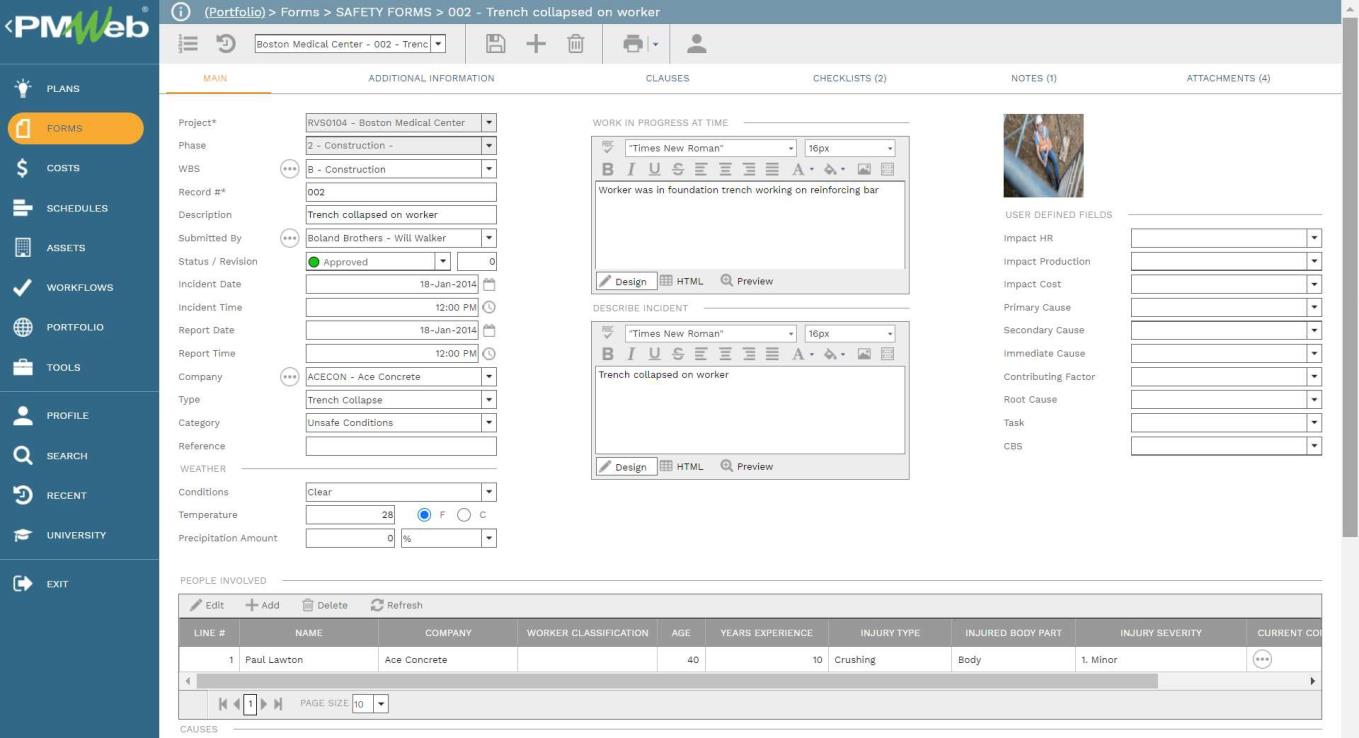
The data describes the work activity in progress at the time of the incident, the incident itself, all persons involved in the incident, their injuries, a list of witnesses to the incident, and causes and root causes that resulted in the incident. This data becomes subject to a formal root cause analysis that recommends corrective actions and is distributed to the persons involved in the accident. Pictures relating to the incident, police and medical reports, and other related documents can be uploaded, stored, and attached to the safety incident form.
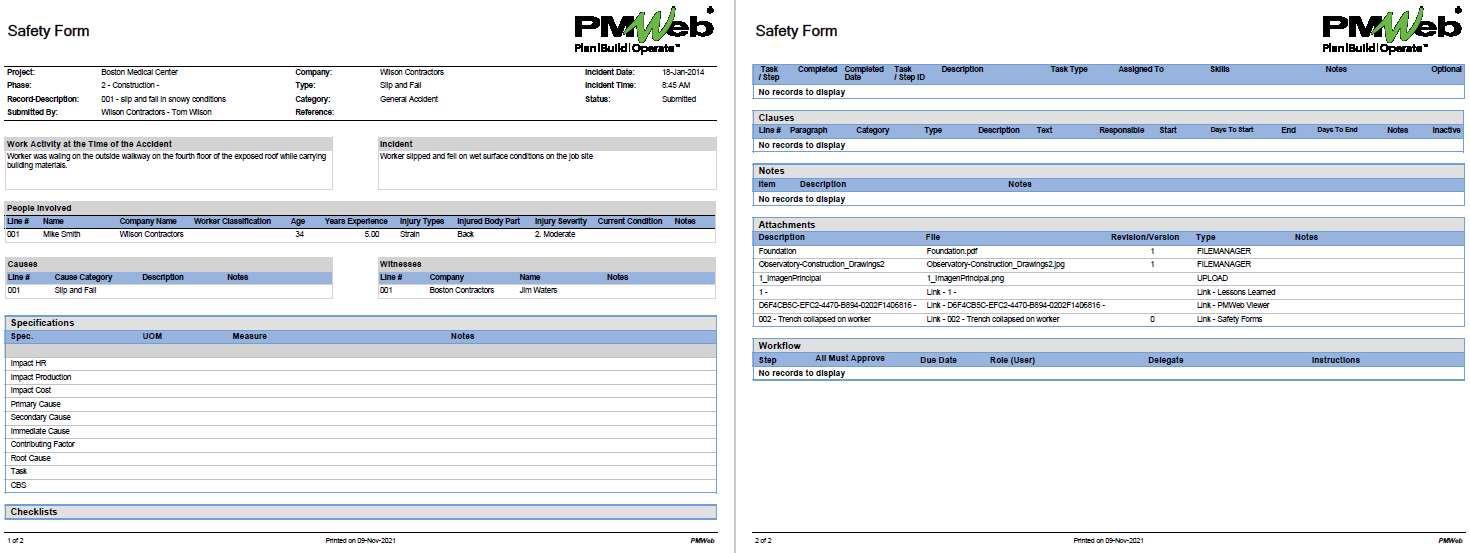
The Safety Incident form must be printed, wet signed, and stamped like all other formal communications. The output form layout may be designed in any desired form and format to meet the organization’s project HSSE management plan reporting requirements. PMWeb also provides a default output that captures the details of the safety incident and can be used as-is.
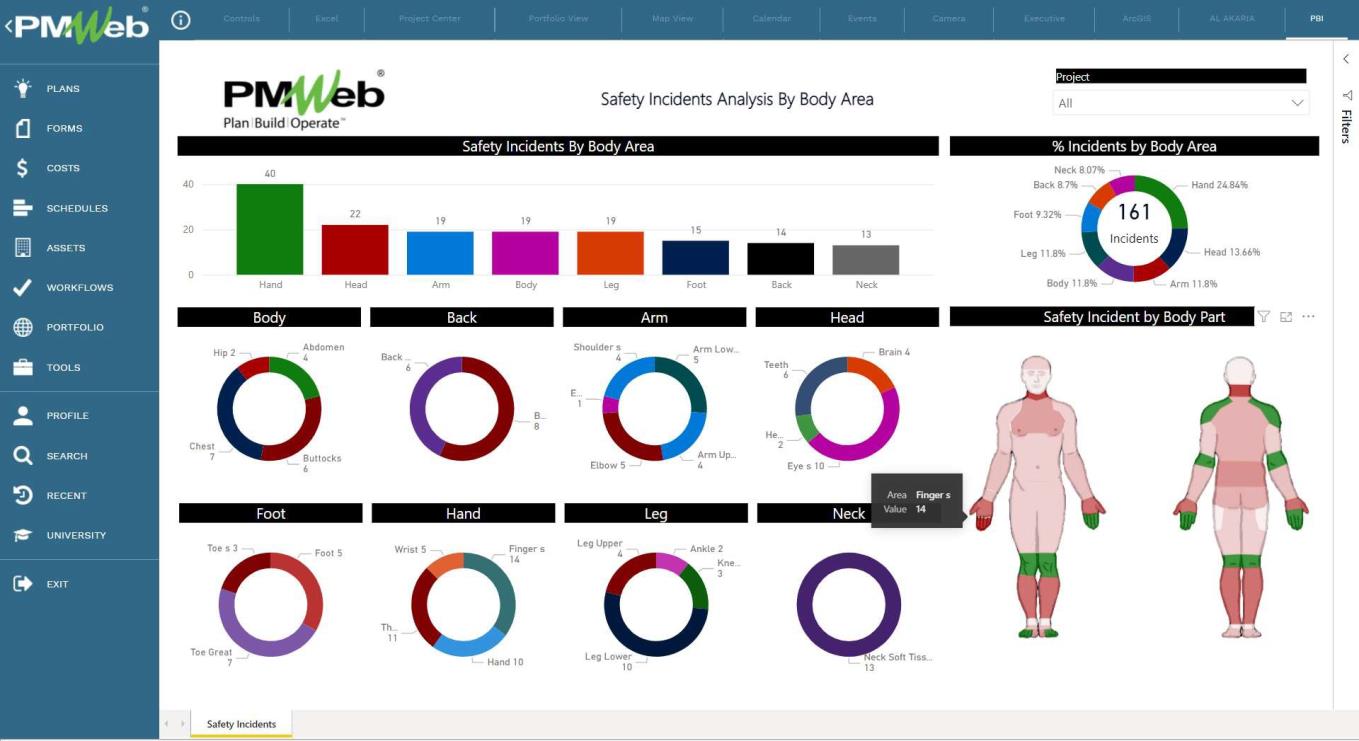
The data that is captured in the safety incident forms serves as the basis for monitoring and evaluating the project’s HSE performance. One of the important reports generated from the safety incident forms is the Safety Incidents Analysis by Body Area report. This report, which can be for a single project or a portfolio of projects, details the reported safety incidents in the injured body area.
Reference
The content of this article was extracted from the book titled “Let’s Transform: Enabling Digital Transformation of Capital Construction Projects Using the PMWeb Project Management Information System – 2nd Edition” written by Bassam Samman.
The book provides project owners with oversight on how technology available today can support their efforts to digitally transform the management of their projects’ portfolios. For each capital project life cycle stage, PMWeb is used to detail how the relevant project management business processes can be digitalized to enforce transparency and accountability in delivering projects. In addition, MS Power BI was used to show how the real-time, trustworthy data captured in PMWeb can be aggregated, modeled, monitored, evaluated, analyzed, and reported at any time, anywhere using any device.

