One of the key challenges that face project-centric or project-driven organizations and in particular those in the public sector is how to have a real-time single version of the truth of the performance of each strategic objective measure or outcome that can be traced to the source of the provided performance data. It is very common that some of those measures are the outcome of realized benefits of executed projects while others could be simply from operations or non-project-related activities. In addition, many of the project-related measures could be the result of more than a single project. For example, the measure of reducing Carbon Monoxide emission could be the outcome of infrastructure improvement projects, renewable energy projects, plantation and landscaping projects, implementing new environmental regulations, etc.
Regardless of what the strategy perspectives or pillars, objectives, and measures used by the organization are, monitoring, evaluating, and reporting the strategy performance always displays for each measure at the end of each reporting period what was planned to be achieved, actually achieved and the variance between planned and actual. Those measures can be either percentages, quantities, or monetary values. To enable the organization to have a consolidated performance status value, the values of the measures need to be converted into percentages by dividing each period’s planned and actual values by the planned value at end of the strategy 3 or 5-year plan period. For example, assume that the Roads Authority wants to reduce the number of fatal accidents to 0 from the current 10 fatal accidents per annum. If the planned measure is to reduce those fatal accidents to 8 accidents at the end of year one, then this represents 20% of the planned target. Further, if the actual achievement measure was 9 accidents at the end of the same period, then this represents 10% of the planned target.
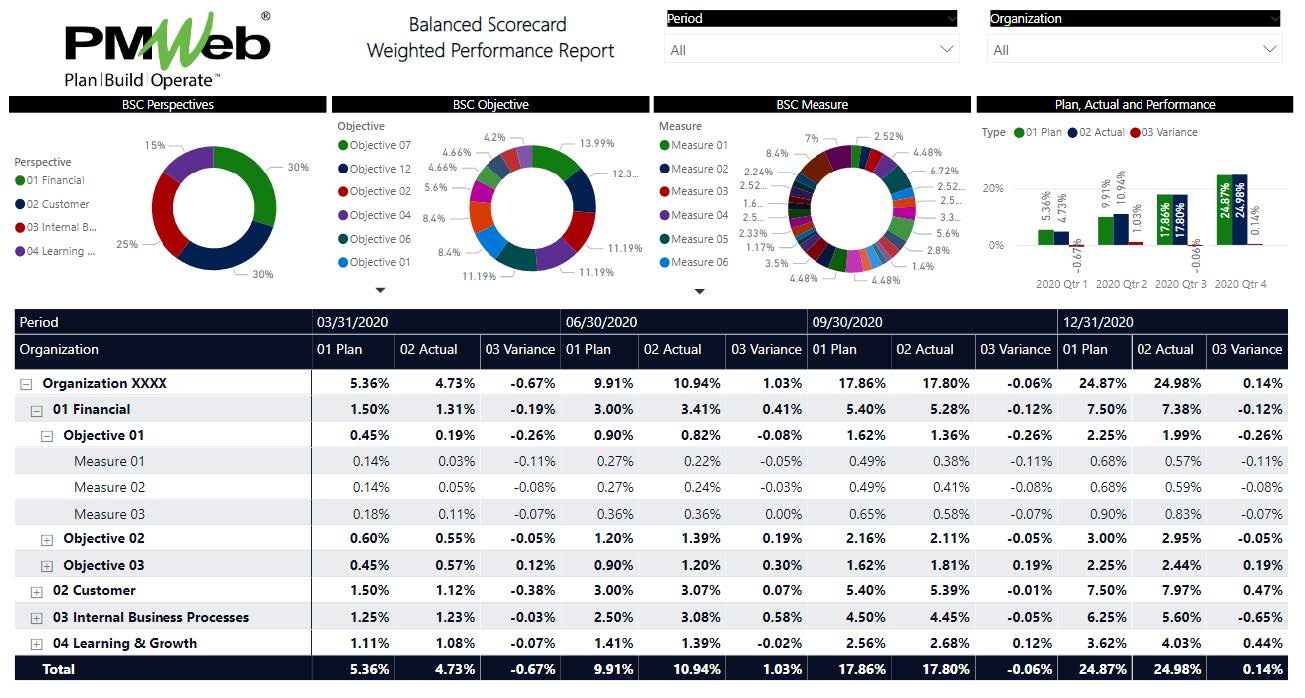
In addition, achieving a single consolidated strategy performance status at the end of each period requires establishing the weight for each strategy perspective, objective, and measure. This becomes the basis for calculating the weight of each measure for which the total for all weighted measures is 100%. The weighted measure helps summarize the planned and actual strategy performance status. The report below displays a histogram that summarizes the strategy performance value at the end of each period. For each period, the histogram shows the total planned, total achieved, and total variance in percentage values. The report also shows three donut charts to detail the weight of each perspective, objective, and measure. The table details the planned, actual, and variance measure values at the end of each period being a quarter. The report also includes filters for selecting the periods to be displayed and the organizational unit responsible for those measures.
Project Management Information System (PMIS) solutions that have the functionality for capturing the benefits or outcomes of projects like PMWeb can be used to address this challenge. To start with, the PMWeb program module helps create the departments and strategic programs or strategic initiatives that an organization has for strategy execution and performance reporting. All projects, regardless of whether they were capital construction projects, information technology, new legislation, process improvement, etc., are captured in PMWeb and tagged to its relevant program. For non-project measures, a project is added for each department or business unit involved in reporting strategy performance.
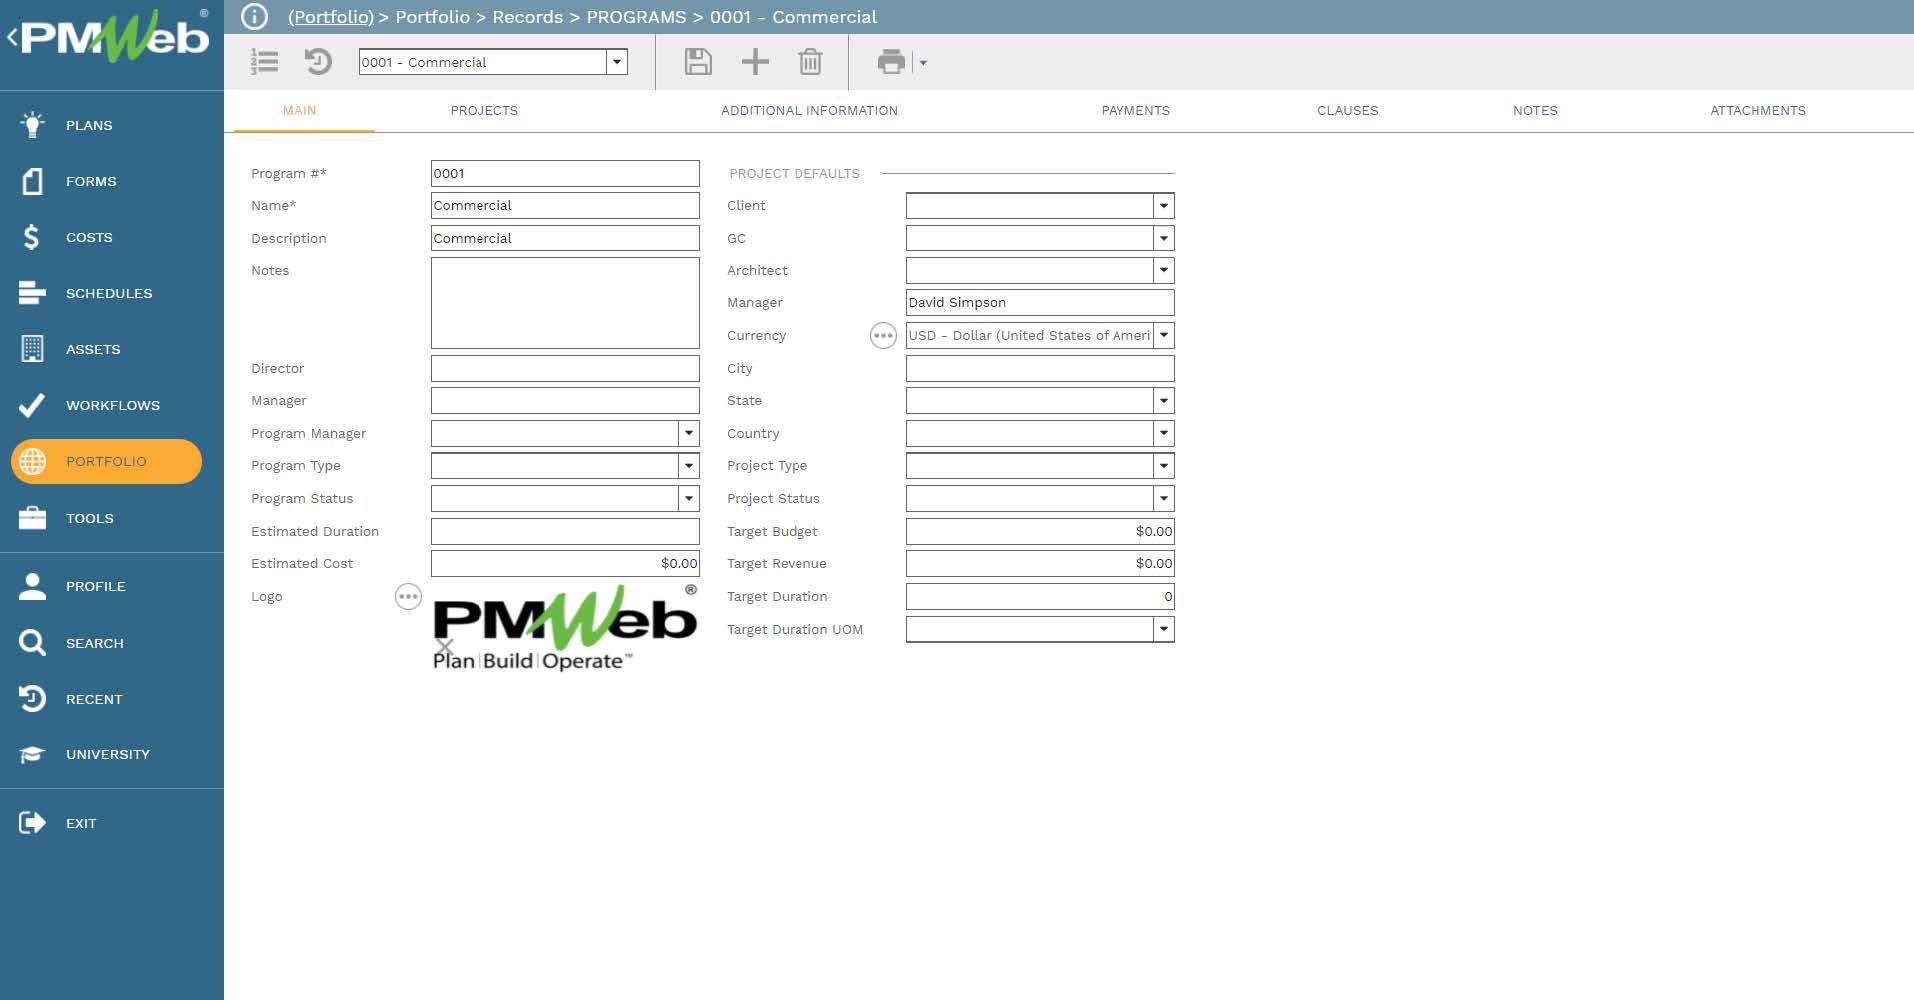
Although PMWeb helps manage all business processes required to manage the projects captured in each program, nevertheless, it is the organization that decides what should be addressed in managing the strategic benefits or outcomes of all strategic measures whether they were project-related on not. The income contract module helps capture the details of all strategy performance measures associated with a project. For each measure, PMWeb captures the planned performance at the end of each period and other details that might be required.
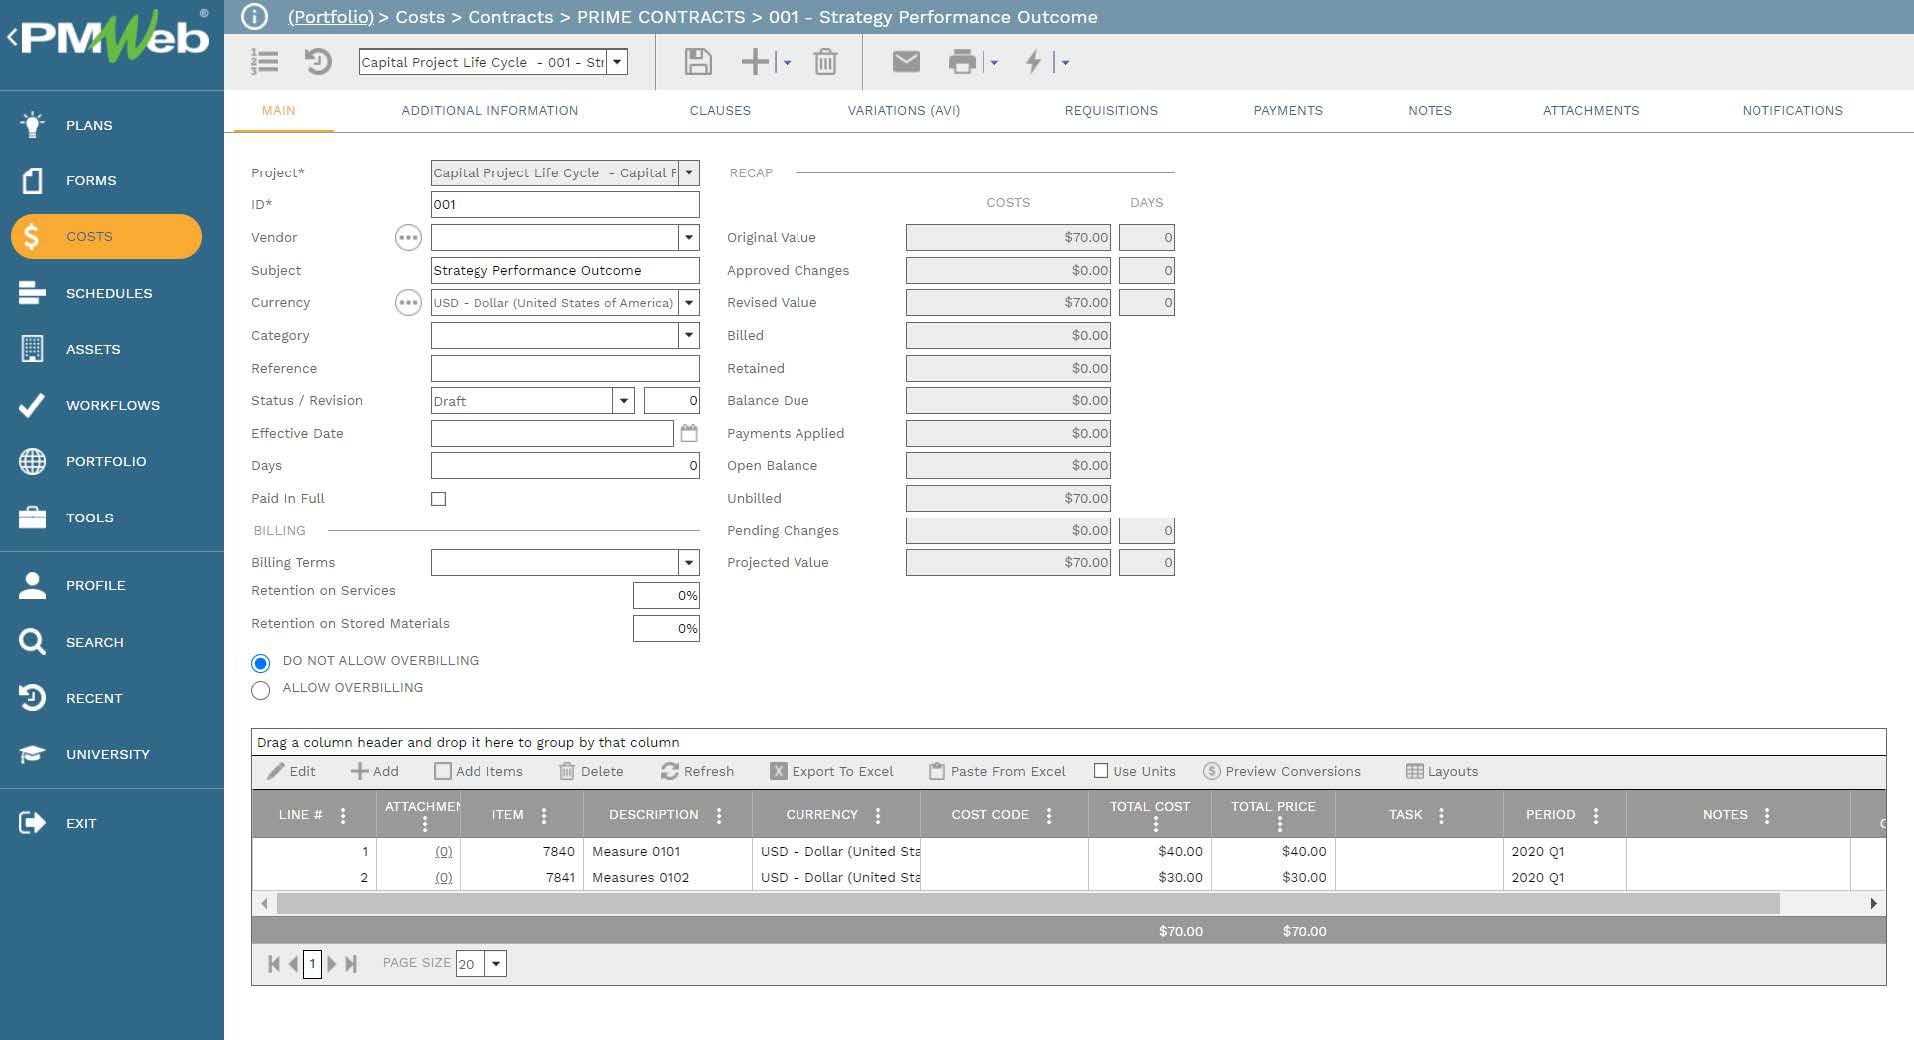
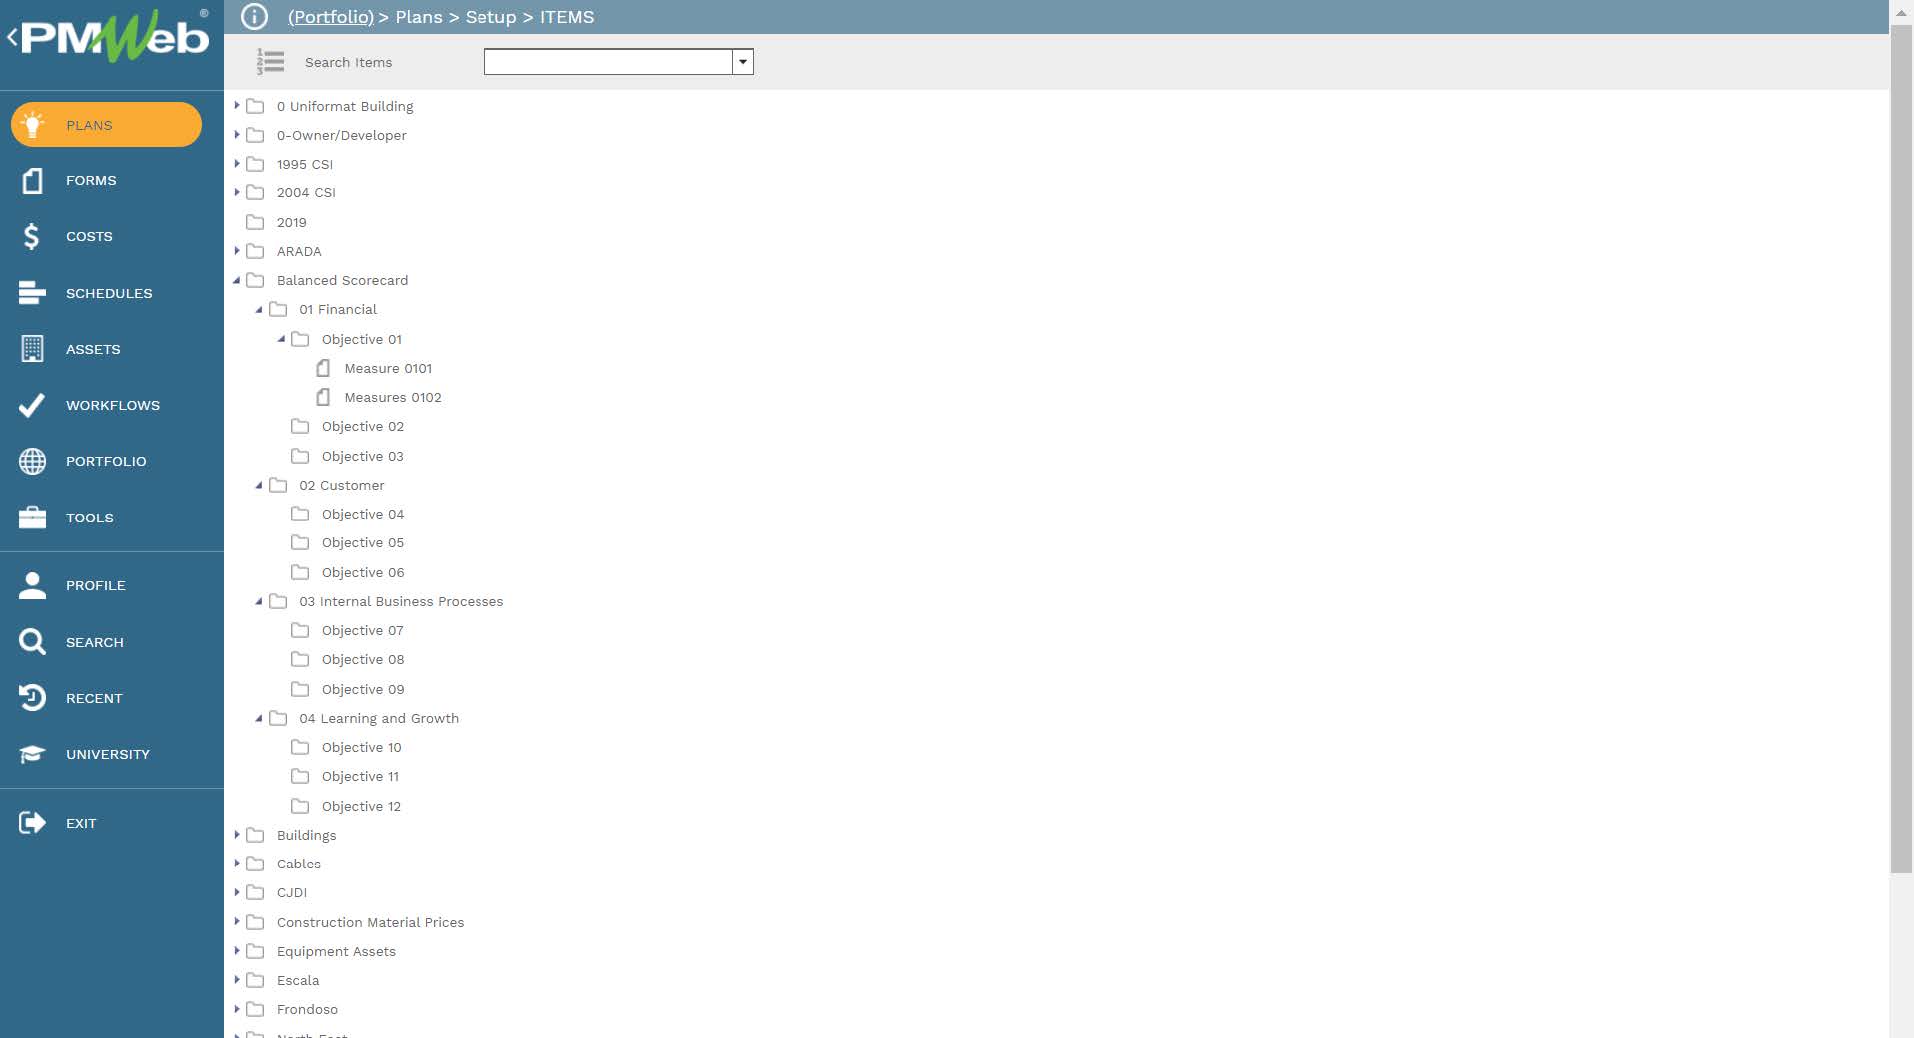
Since the same strategic measures could be used on different projects and even multiple contracts within the same project if needed, it is important to standardize those measures. This is achieved using the PMWeb items module for which it creates and groups those measures by strategy perspective and strategic objective. This enables drag and drop those items into the different contracts that are created in PMWeb.
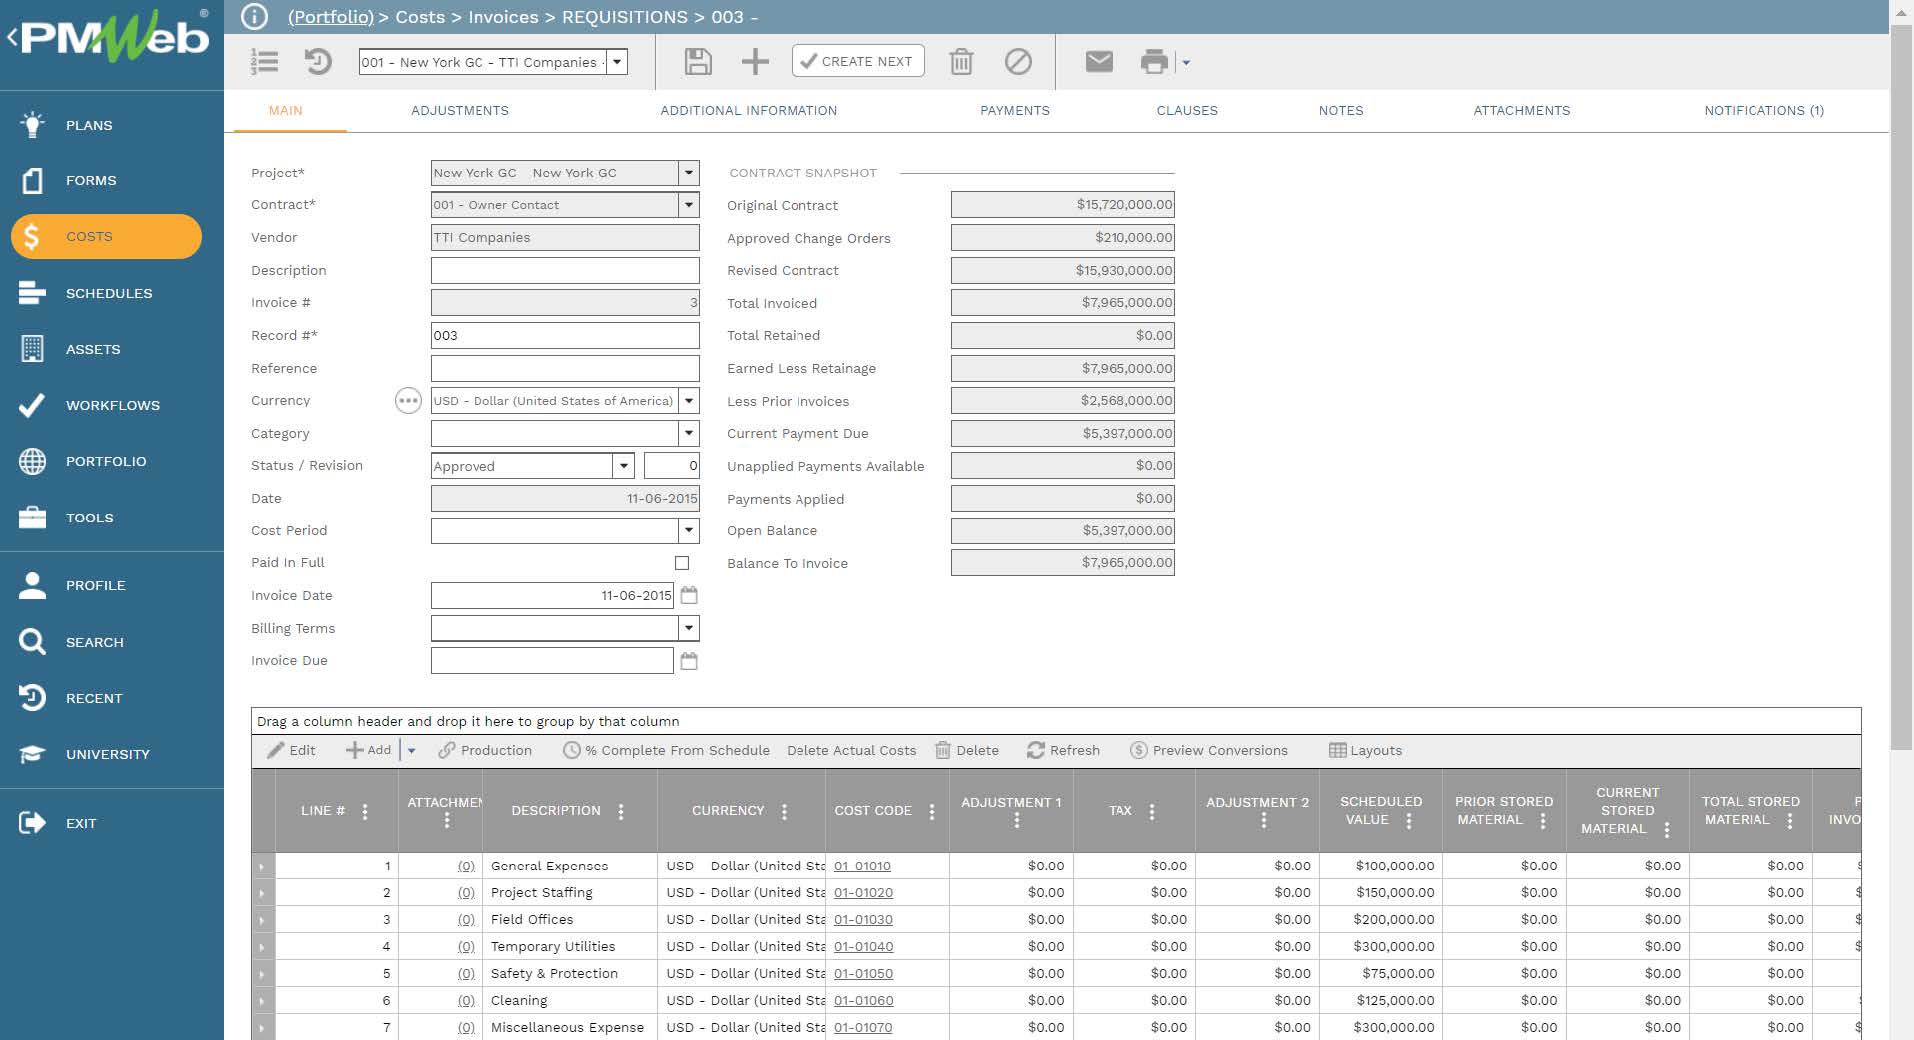
PMWeb requisition module captures the actual performance achieved for each measure. The frequency for reporting the performance of those measures could be at end of each month, quarter, or any other period. This process is repeated at the end of each performance period until the 3-year or 5-year strategy plan is over.
Using the PMWeb income contract module provides the option of capturing the details of all changes that might have been done to the planned performance of the strategic measures. Those could be to increase or decrease those values for a specific period or periods or as an overall. The details of all those changes is captured in the contract’s change order module.
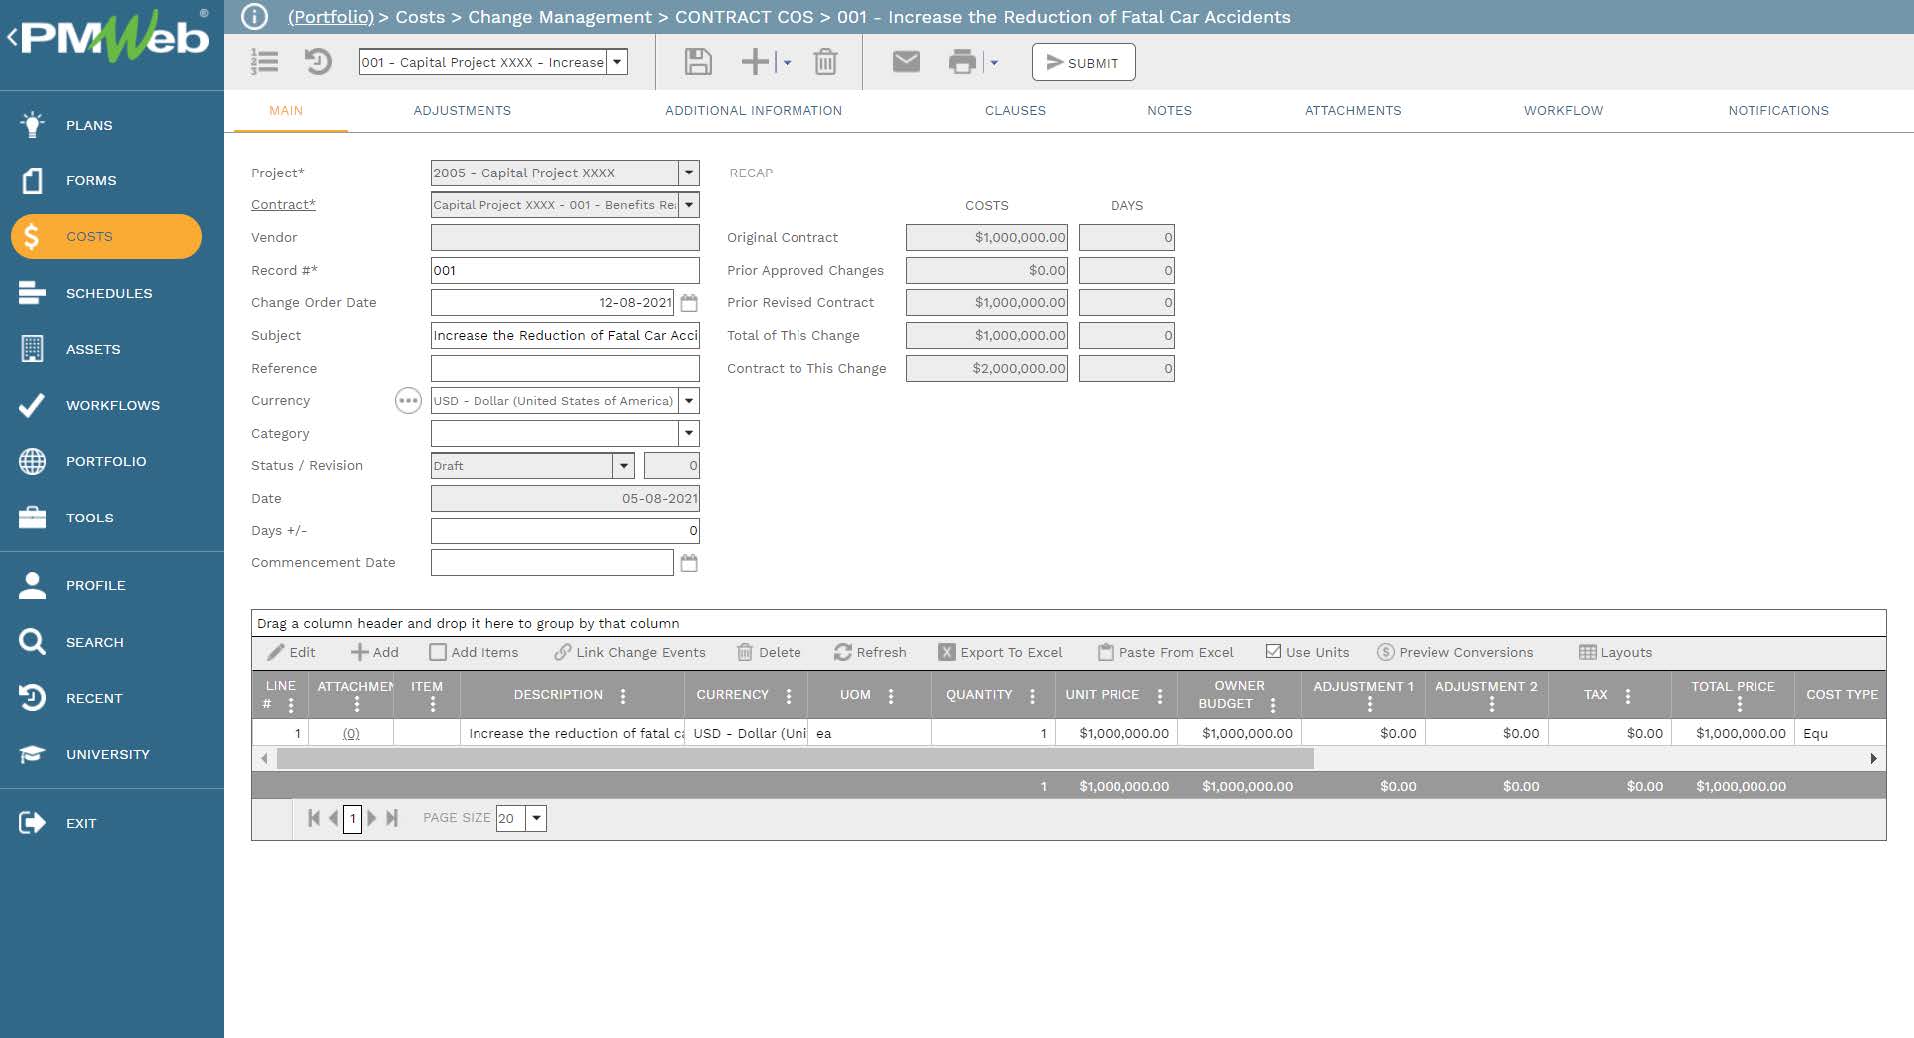
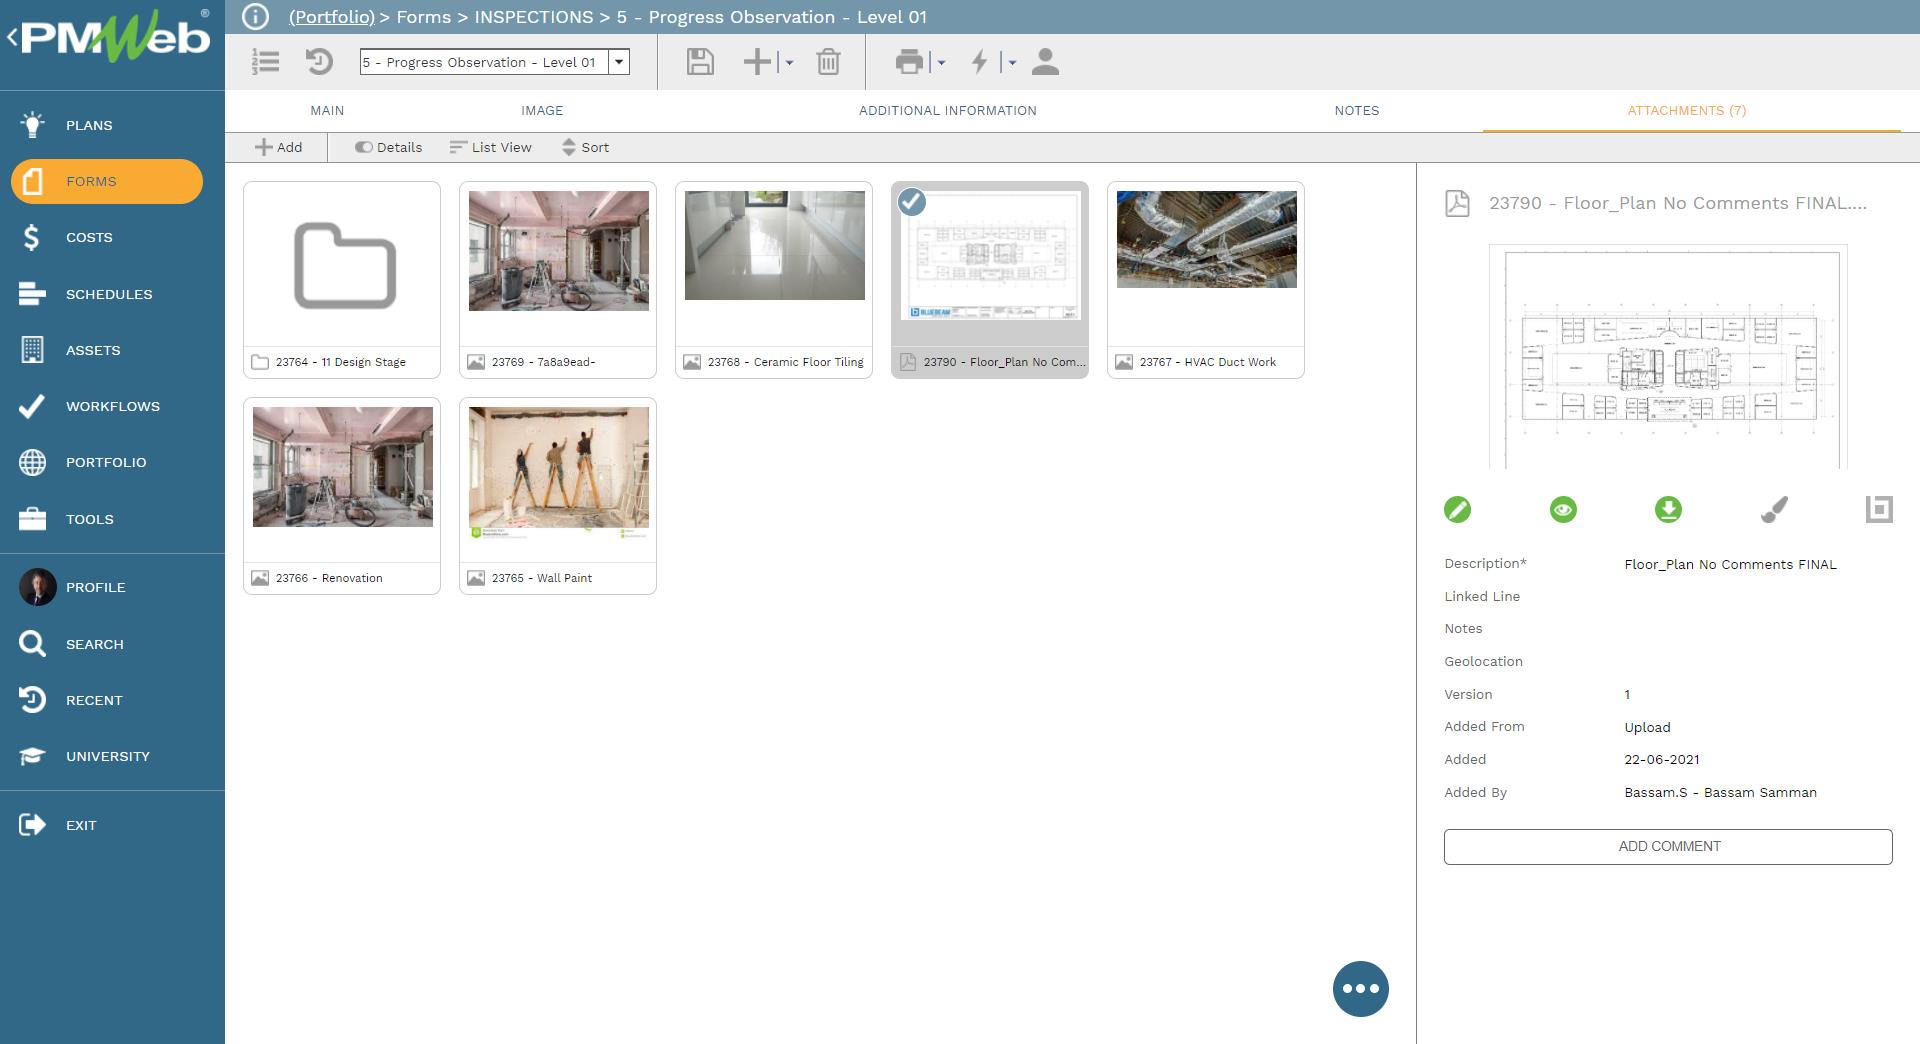
Although the input template for each business process should be comprehensive in the extent of the data fields needed to capture the needed data, nevertheless, it is also very common that each transaction of each business process could include supportive documents associated with that transaction. PMWeb allows attaching those documents to each transaction of each business process template. It is highly recommended to add details to each attached document to better explain to the reader what is being attached and viewed. In addition, links to other relevant transactions or records of other business processes managed in PMWeb can be also added.
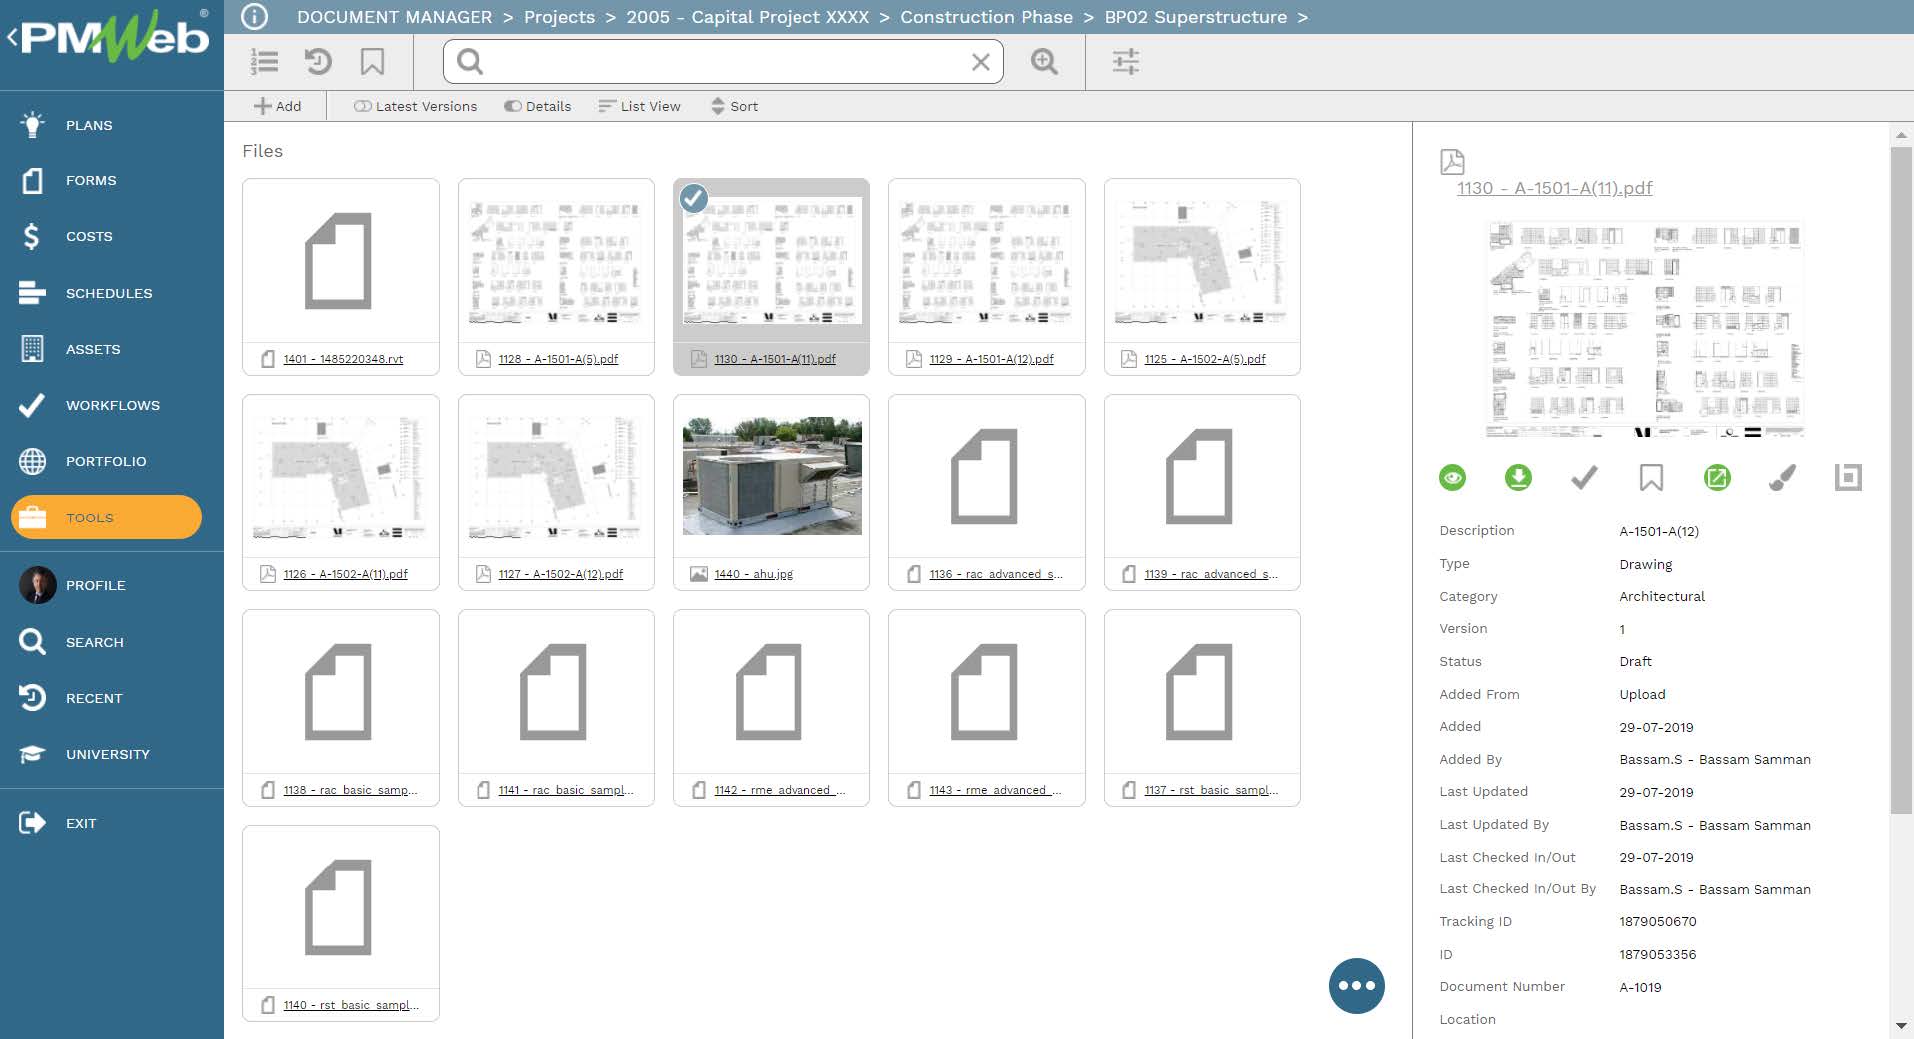
It is highly recommended that all those supportive documents, regardless of their type or source, get uploaded and stored on the PMWeb document management repository. PMWeb allows creating folders and subfolders to match the physical filing structure used to store hard copies of those documents. Permission rights can be set to those folders to restrict access to only those users who have access to do so. In addition, PMWeb users can subscribe to each folder so they can be notified when new documents are uploaded or downloaded.
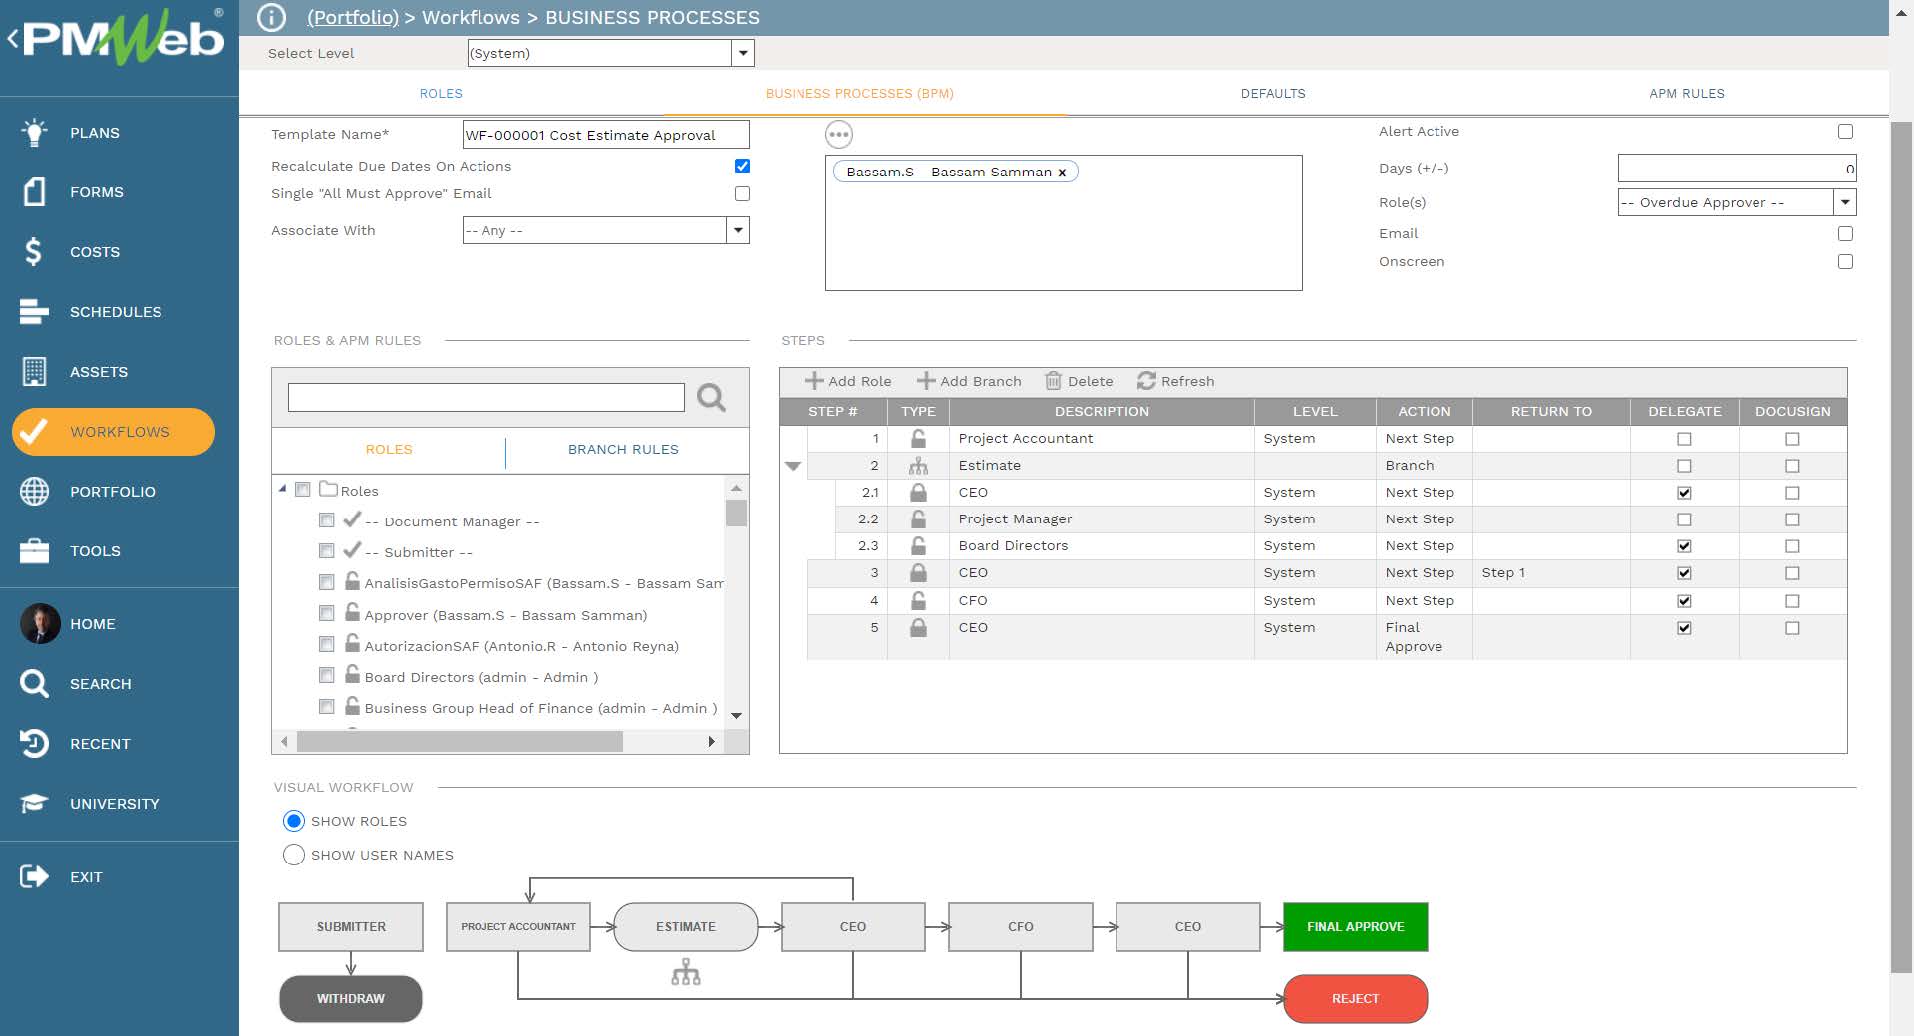
To enforce transparency and accountability in reporting the performance of the different strategic measures, a workflow needs to be added to the contract, periodical reporting and changes templates to map the submit, review and approve tasks, role or roles assigned to each task, task duration, task type and actions available for the task. In addition, the workflow could be designed to include conditions to enforce the approval authority levels as defined in the Delegation of Authority (DoA) matrix.
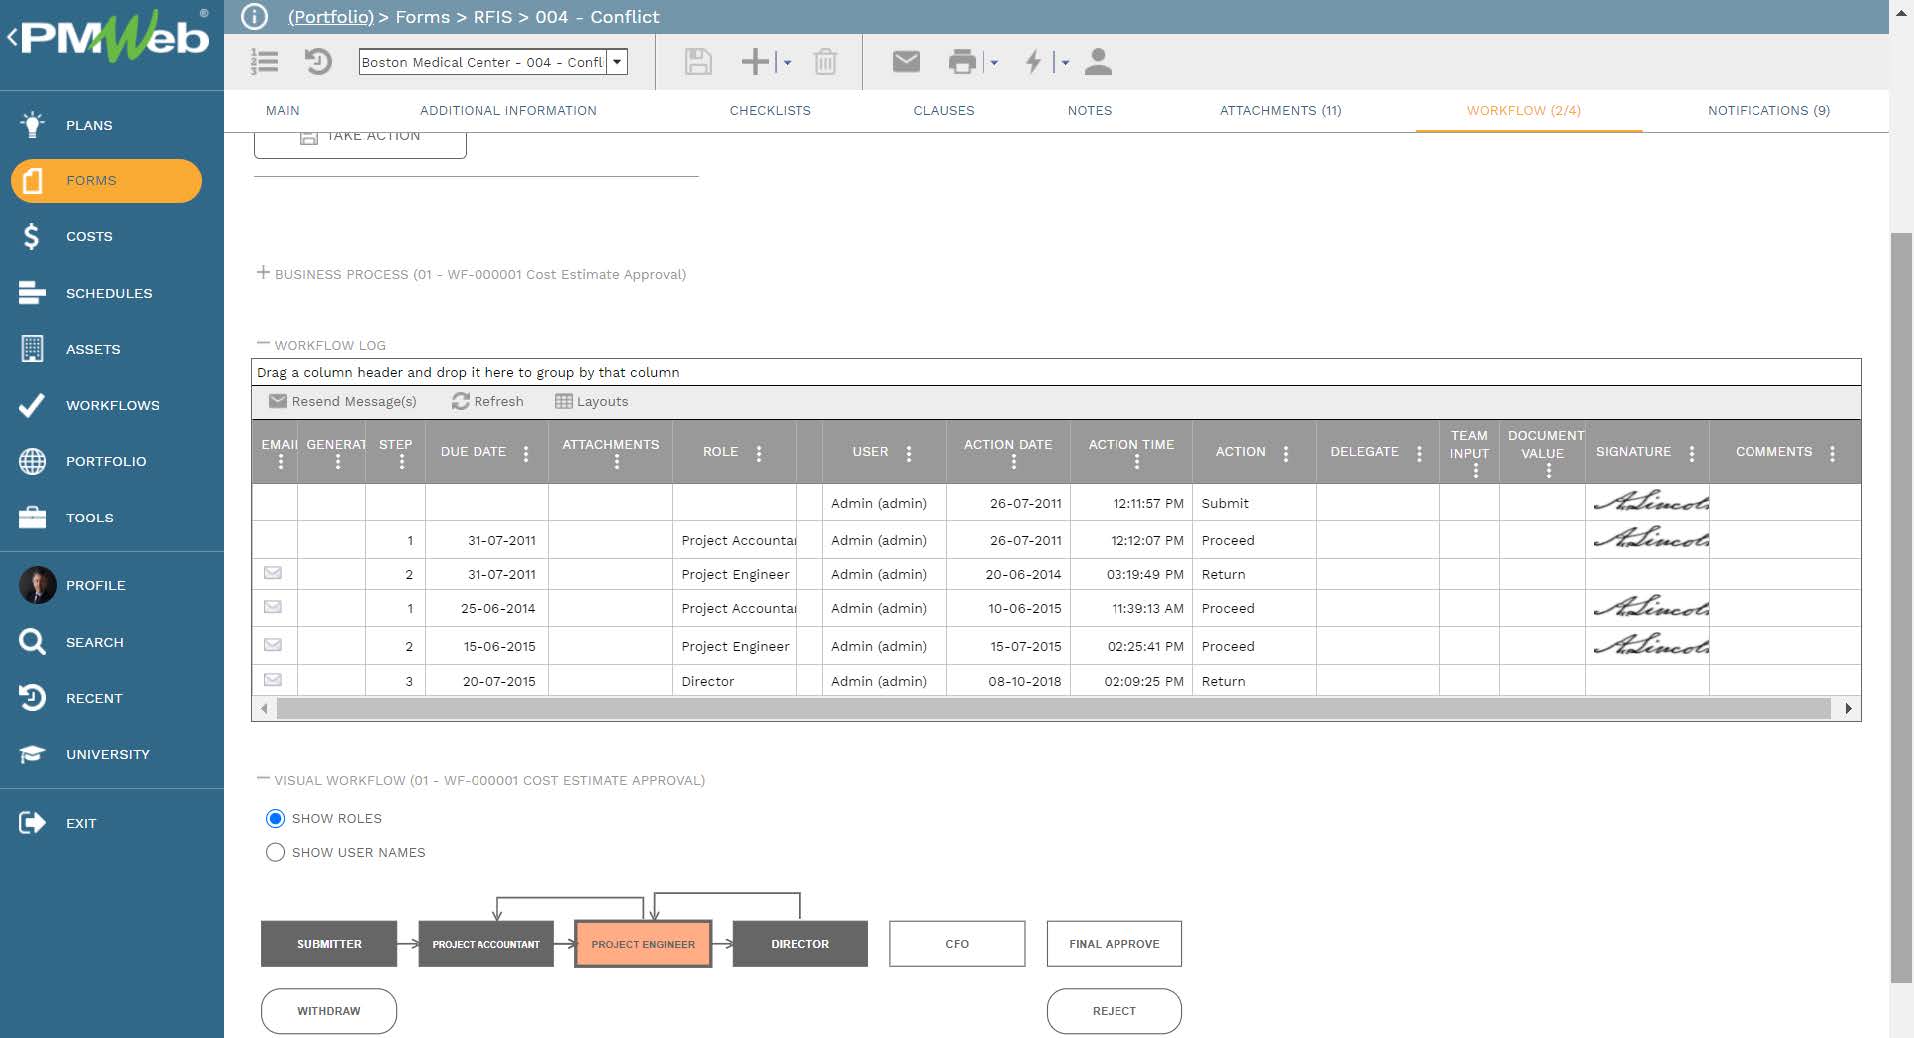
When any of the business processes’ transactions are initiated, the workflow tab available on the relevant template captures the planned review and approve workflow tasks for each transaction as well as the actual history of those review and approval tasks. The captured workflow data includes the actual action data and time, done by who, action taken, comments made, and whether team input was requested.
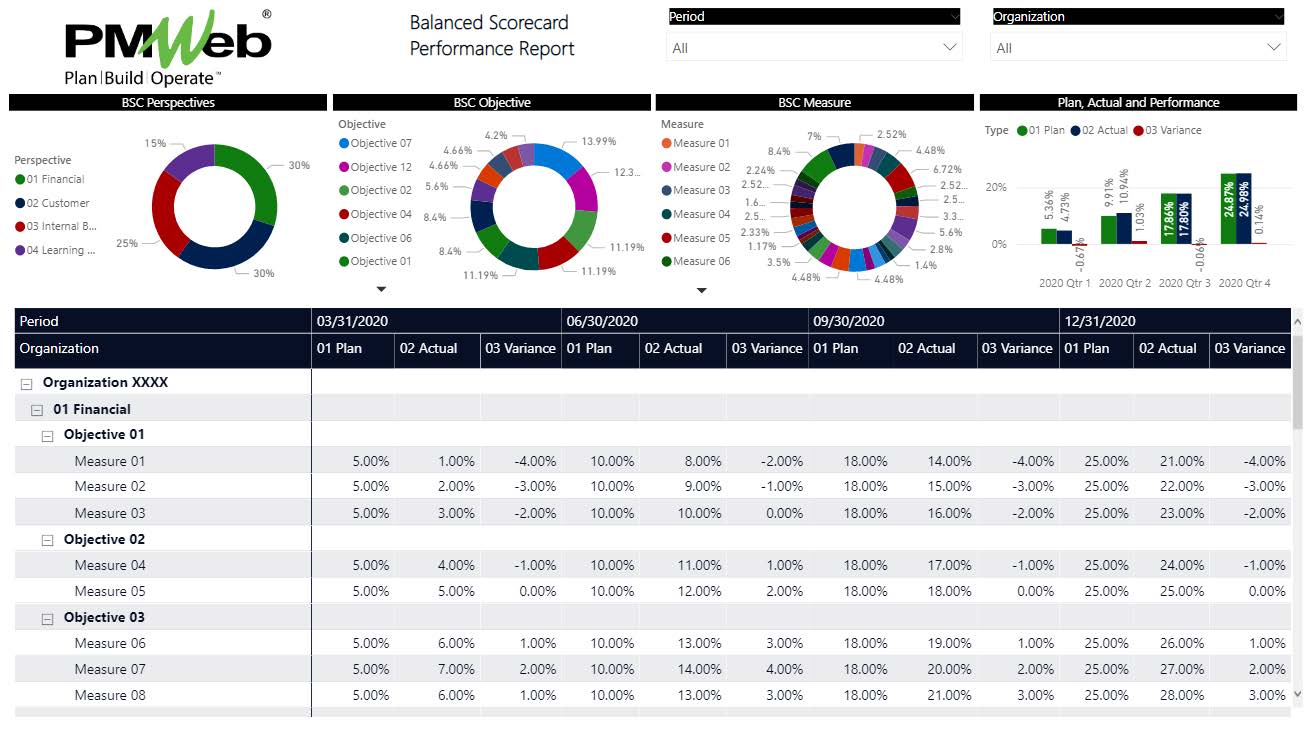
The real-time single version of the truth data captured in those templates becomes the only data source required to generate the strategy performance report. The report can be designed to convert the measures planned and actual quantities from their unit of measure which could be a percentage, numeric value, or monetary amount into a percentage value as explained earlier. By using the weight value for each measure, the reports can be configured to report the weighted planned and actual values for each measure and the variance between actual and planned at the end of each performance period.This report provides the reader with the planned and actual components for the reported performance values. The reader can summarize those values at the strategy perspectives, objectives, or measures. The data can be collapsed or expanded to provide the needed strategy outcome performance measure. The report can be designed to filter the reported data by project, contract, and other data fields captured in the performance reporting business processes.
