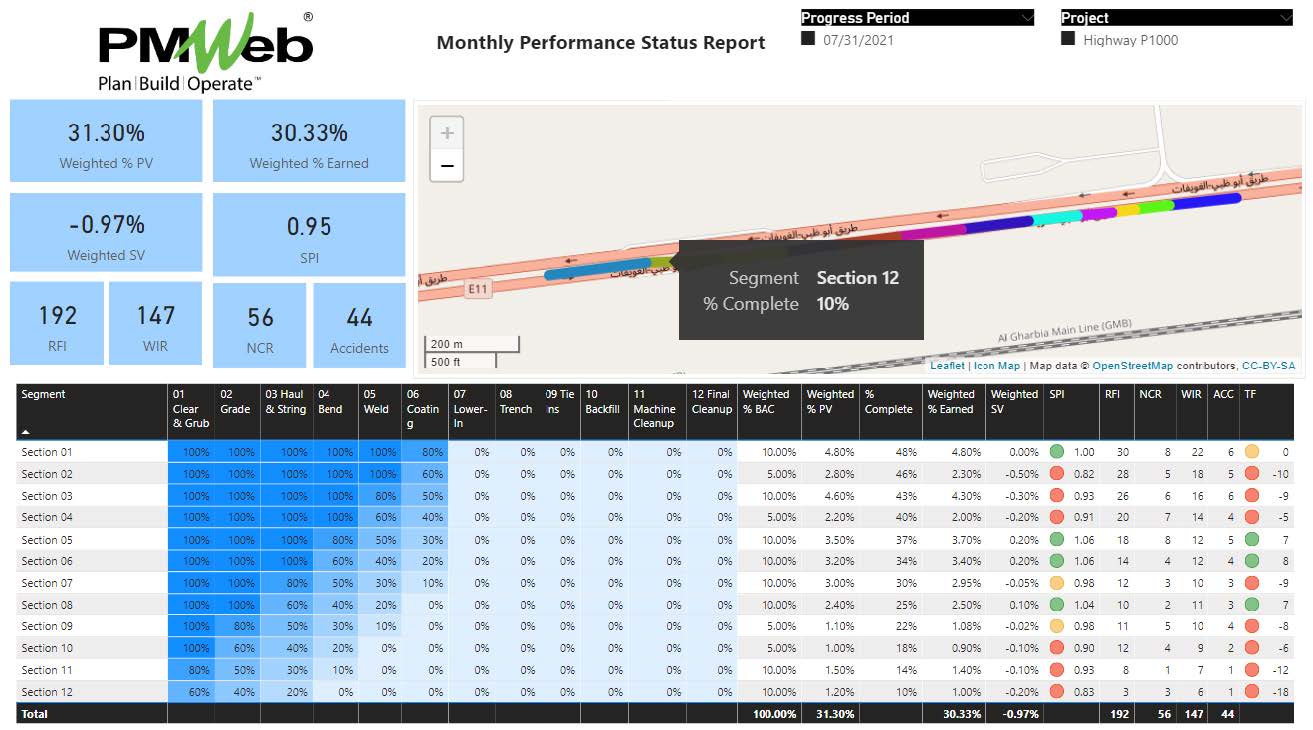
For executive stakeholders of entities involved in delivering linear capital construction projects, they are always keen to have a single-page report that gives them an easy-to-read and understand single version of the truth of how a project is performing. Linear projects include highways, roads, railways, metros, gas, oil, water, wastewater pipelines, services tunnels, culverts, and transmission lines. Usually, those projects include multiple segments or sections for which the activities performed at each segment or section are identical. The number of those activities, which depends on each linear project type could vary between 10 to 20 activities.
For example, a pipeline project can consist of twelve sections or segments for which the start and endpoints of each section are defined by their geospatial coordinates of latitude and longitude values. The length of each section will vary and will usually depend on whether there is a need to build a structure like a pump room or others. For a pipeline project, the common activities for each section could include Clear & Grub, Grade, Haul & String, Bend, Weld, Coating, Lower-In, Trench, Tie Ins, Backfill, Machine Cleanup, and Final Cleanup.
Using a Project Management Information System (PMIS) like PMWeb as the trusted platform to provide a real-time single version of the truth projects performance information coupled with an interactive business intelligence and data visualization tool like MS Power BI easily addresses this challenge. With the many types of visuals available in MS Power BI to visualize and analyze the projects’ performance data captured in PMWeb, there is also a requirement to use a map visual like the one available from “Icon Map”. The reason for selecting this map visually is that it allows showing the start and endpoints of each section in a linear project using the geospatial coordinates of latitude and longitude values.
The content of the performance dashboard can be designed to read all progress details from the different business processes managed in PMWeb as well as the project’s schedule data which can be done using tools like Primavera P6 or linear scheduling tools like Tilos. Nevertheless, the main objective of this performance report is to provide senior executives with an overall performance status of the project and not replace the other reports that detail the performance status of the different business processes managed on the project to which they have access. Therefore, it is highly recommended to base the content of this report on performance details that the project owner’s own project management team provides. The content of the performance report should be completed in no more than one hour without sacrificing the quality and validity of the reported performance.
To achieve this, create a custom form in PMWeb to capture the progress details for each one of the standard tasks for a linear project. The form will have all sections of the linear project predefined for which the planned progress percent complete for the current period and actual earned percent complete for the same period needs to be provided for each section by the assigned individual.
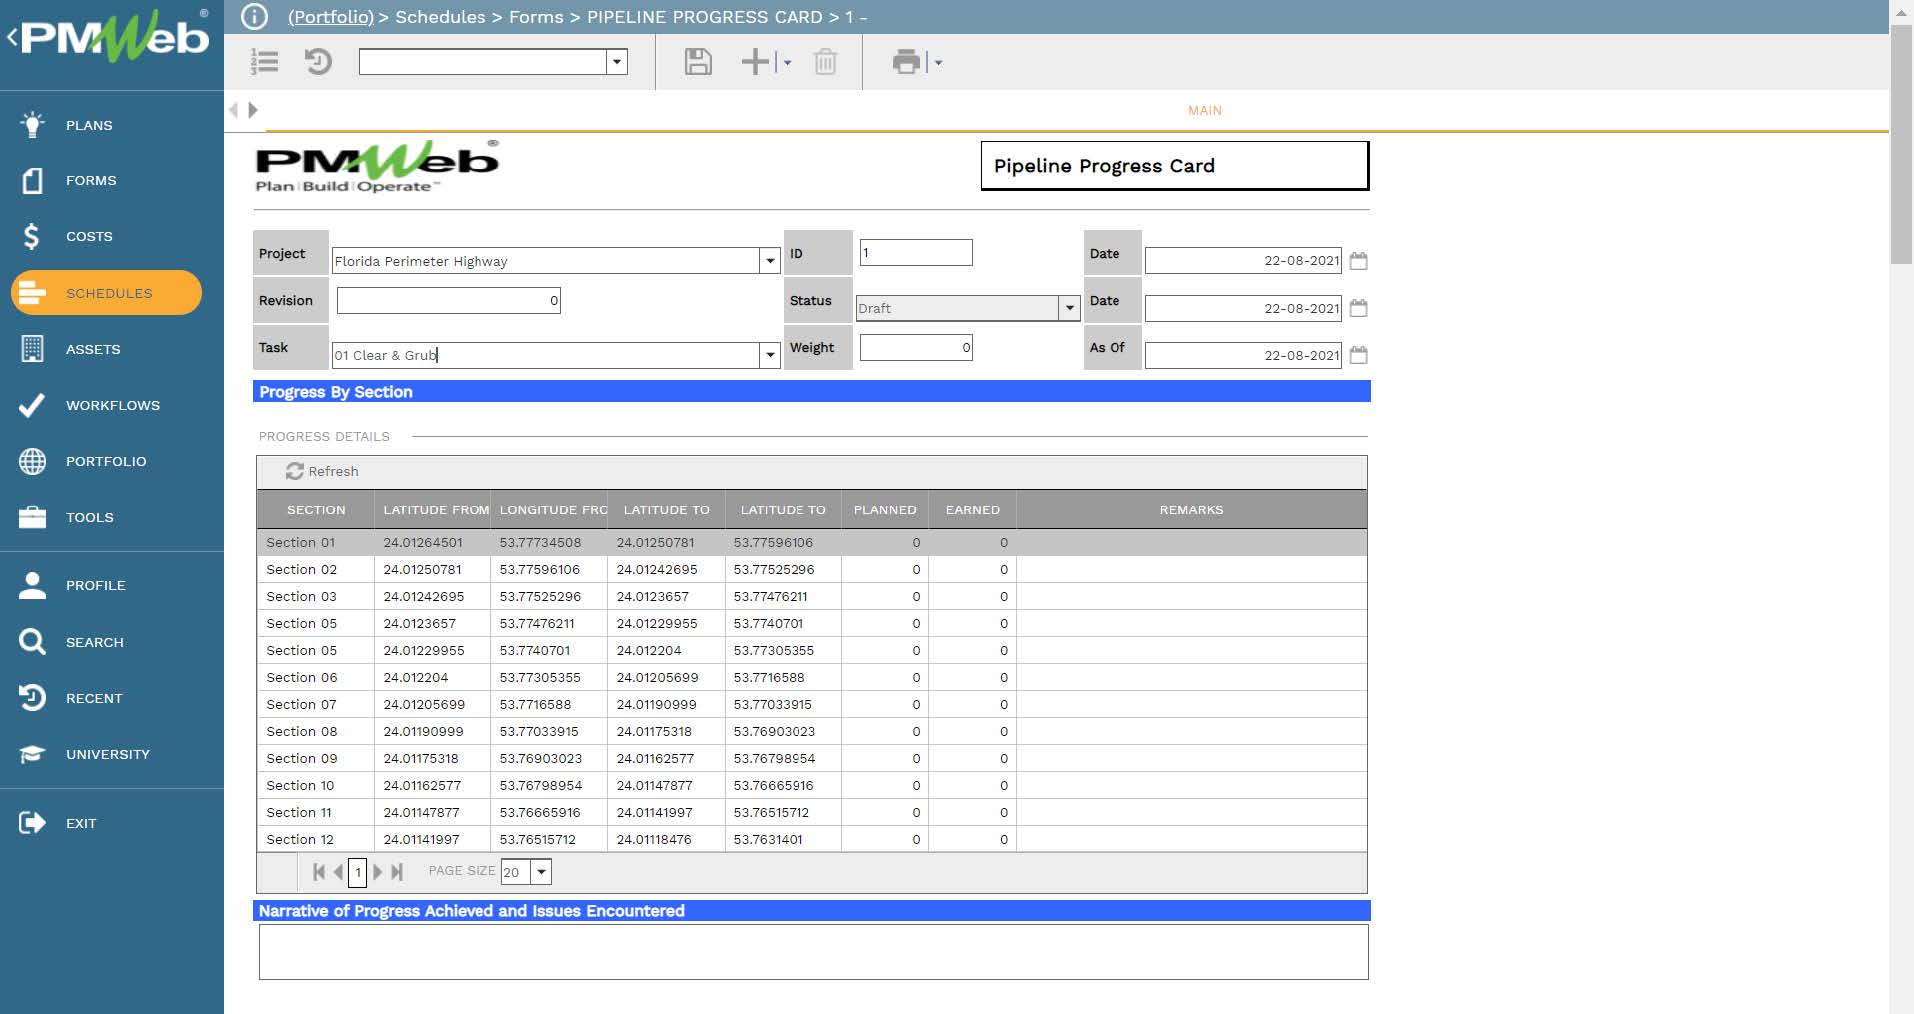
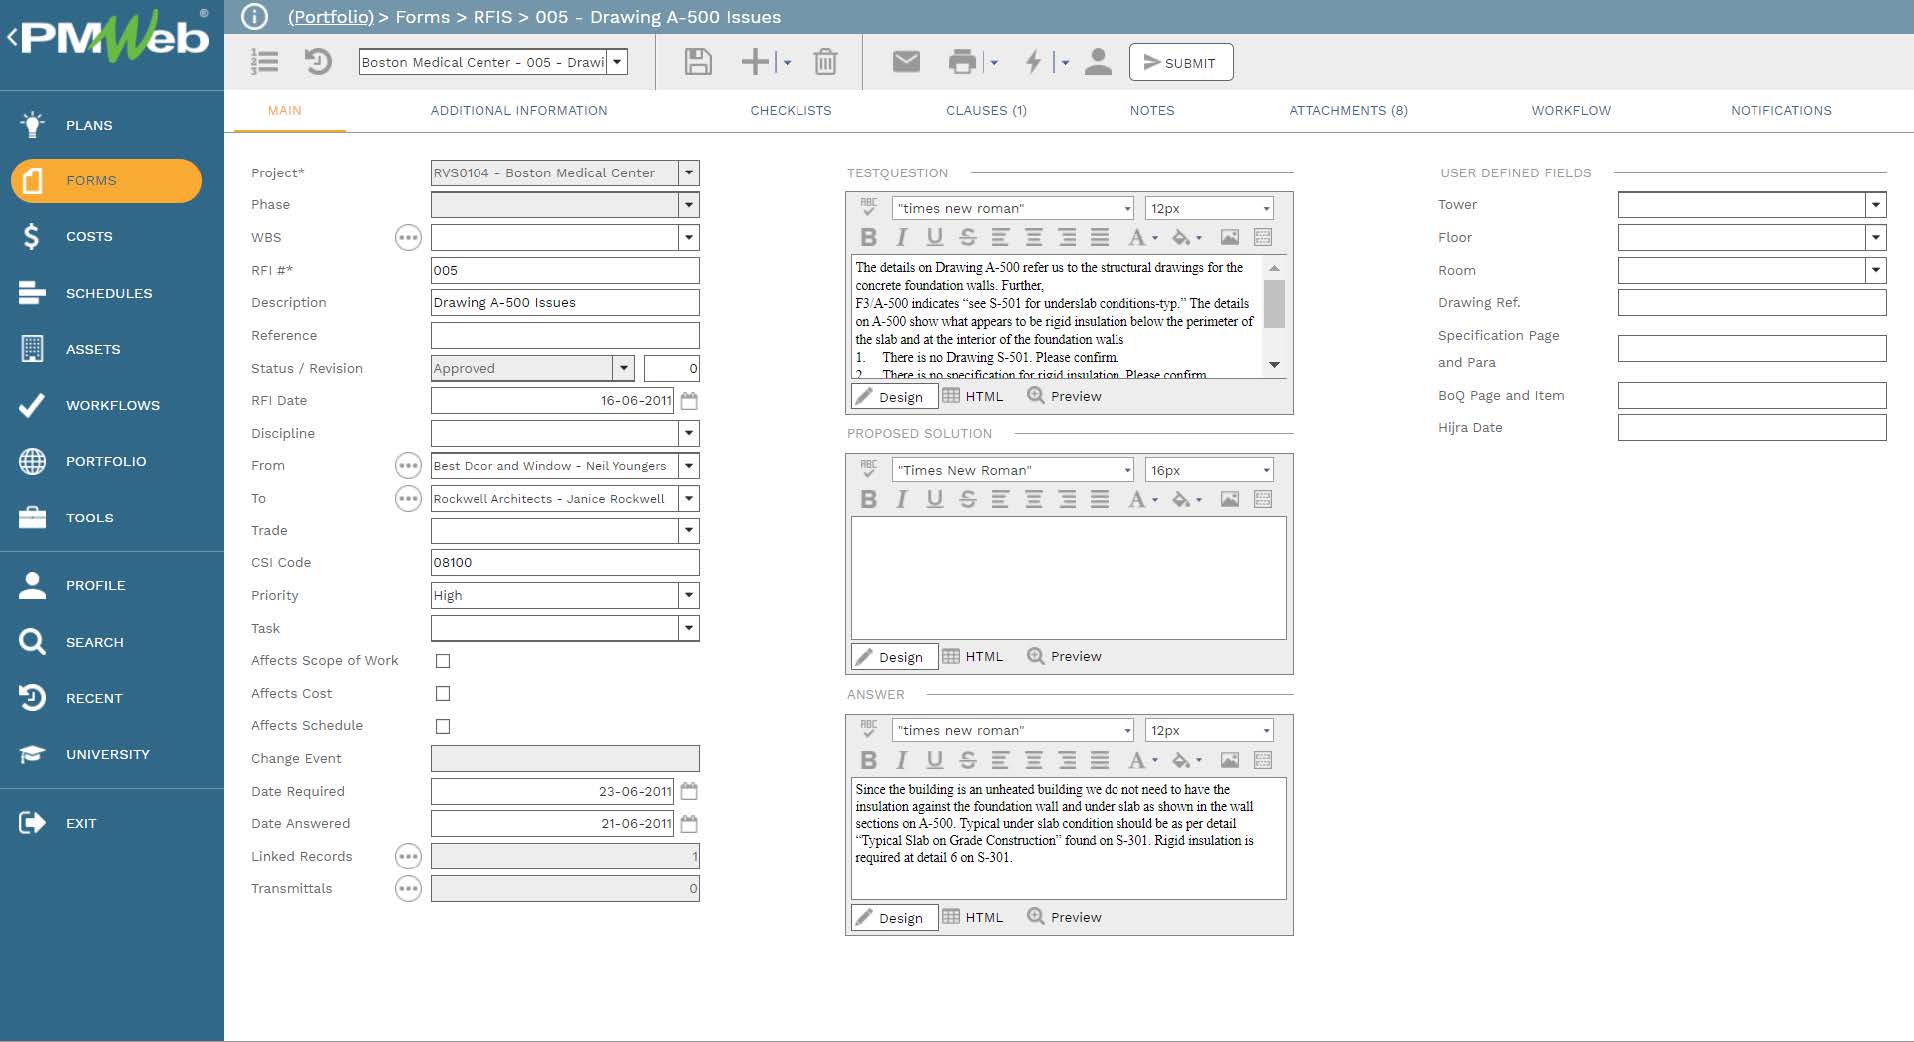
Furthermore, PMWeb extracts the other performance details that relate to the Request for Information (RFI), Non-Compliance Reports (NCR), Work Inspection Requests (WIR), Accidents and any other business process that require reporting, from their relevant business processes managed in PMWeb. The template for each one of those business processes includes two user-defined fields to ensure that they align with the reported performance for each linear project section and task. Accordingly, the first field is for the project section or segment it relates to while the second field is for the standard linear project task that the transaction associates with.
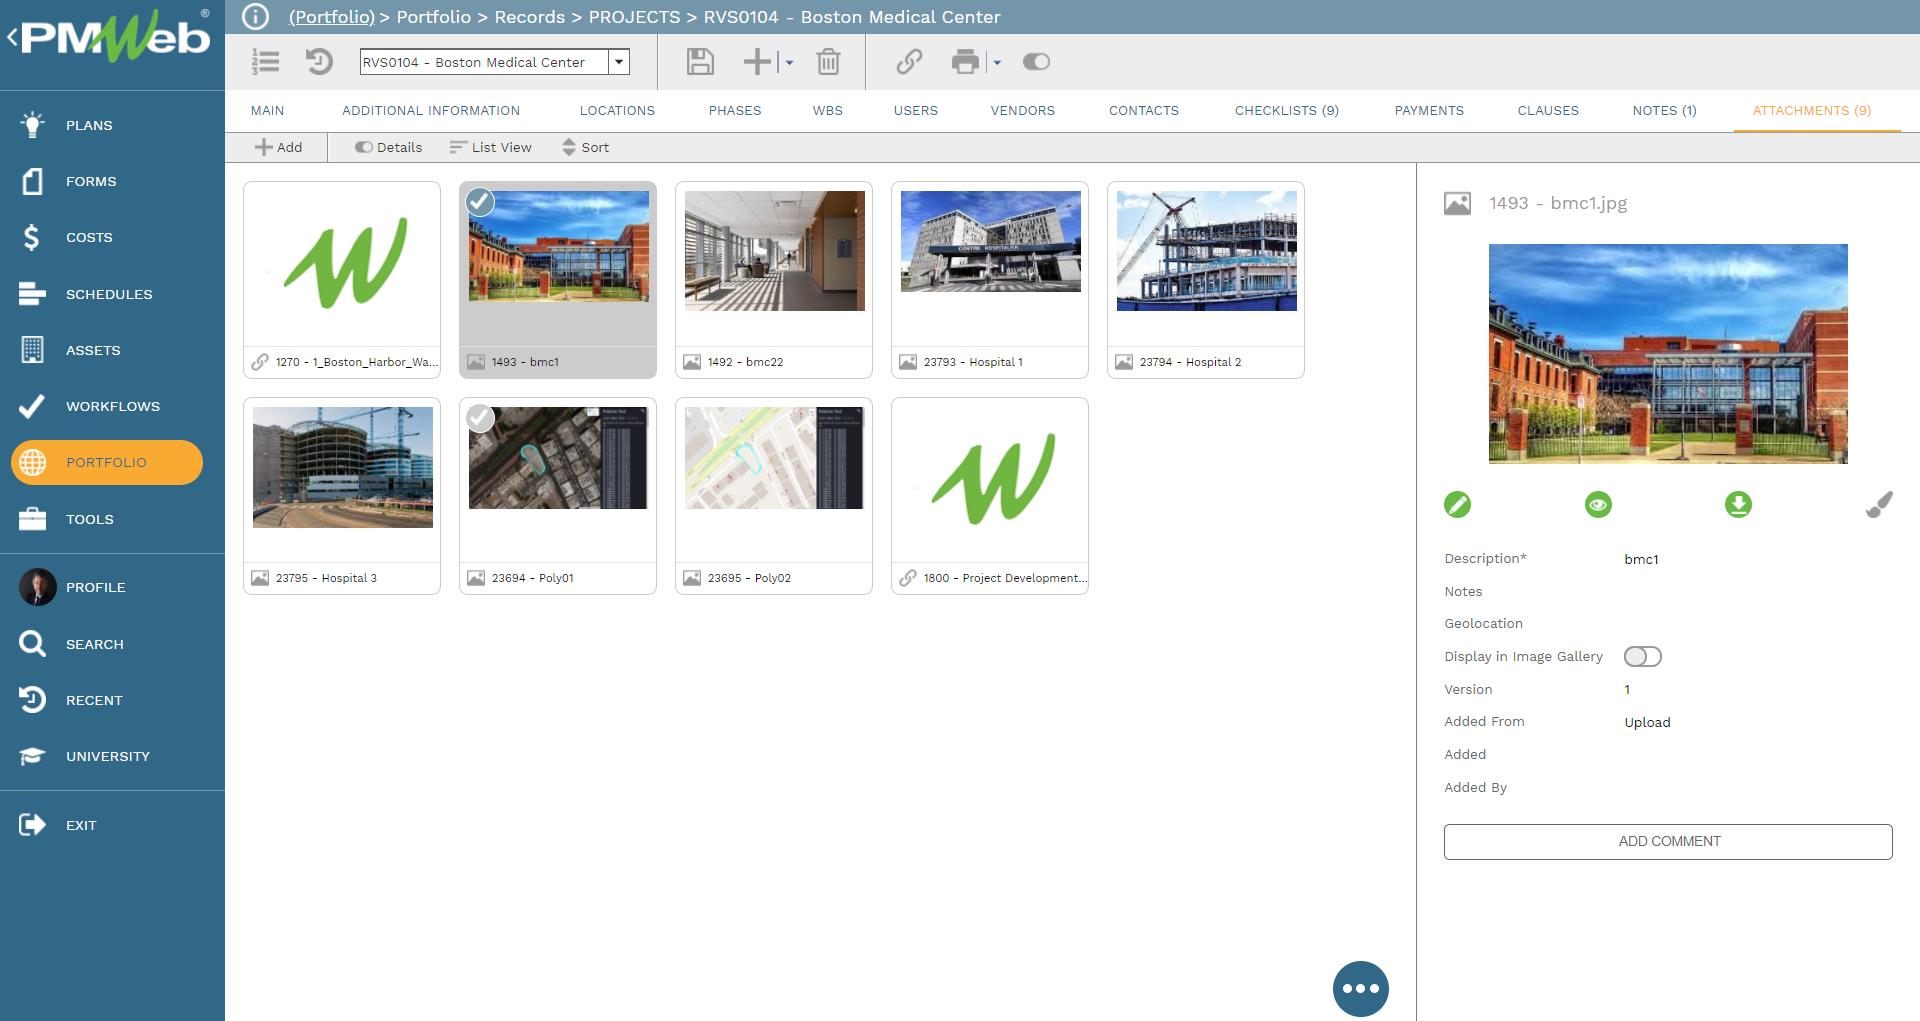
All transactions of all business processes managed in PMWeb including those of the progress report for each linear project task need to be attached with their supporting documents. Those documents could include pictures, drawings, specifications, police reports, hospital statements among many others. Those supportive documents attach in the PMWeb attachment tab in those templates. We recommend adding comments to each attached document to provide a better understanding of what was the document for. The attachment tab also allows the user to link other records for business processes implemented in PMWeb as well as associate URL hyperlinks with websites or documents not stored in the PMWeb document management repository.
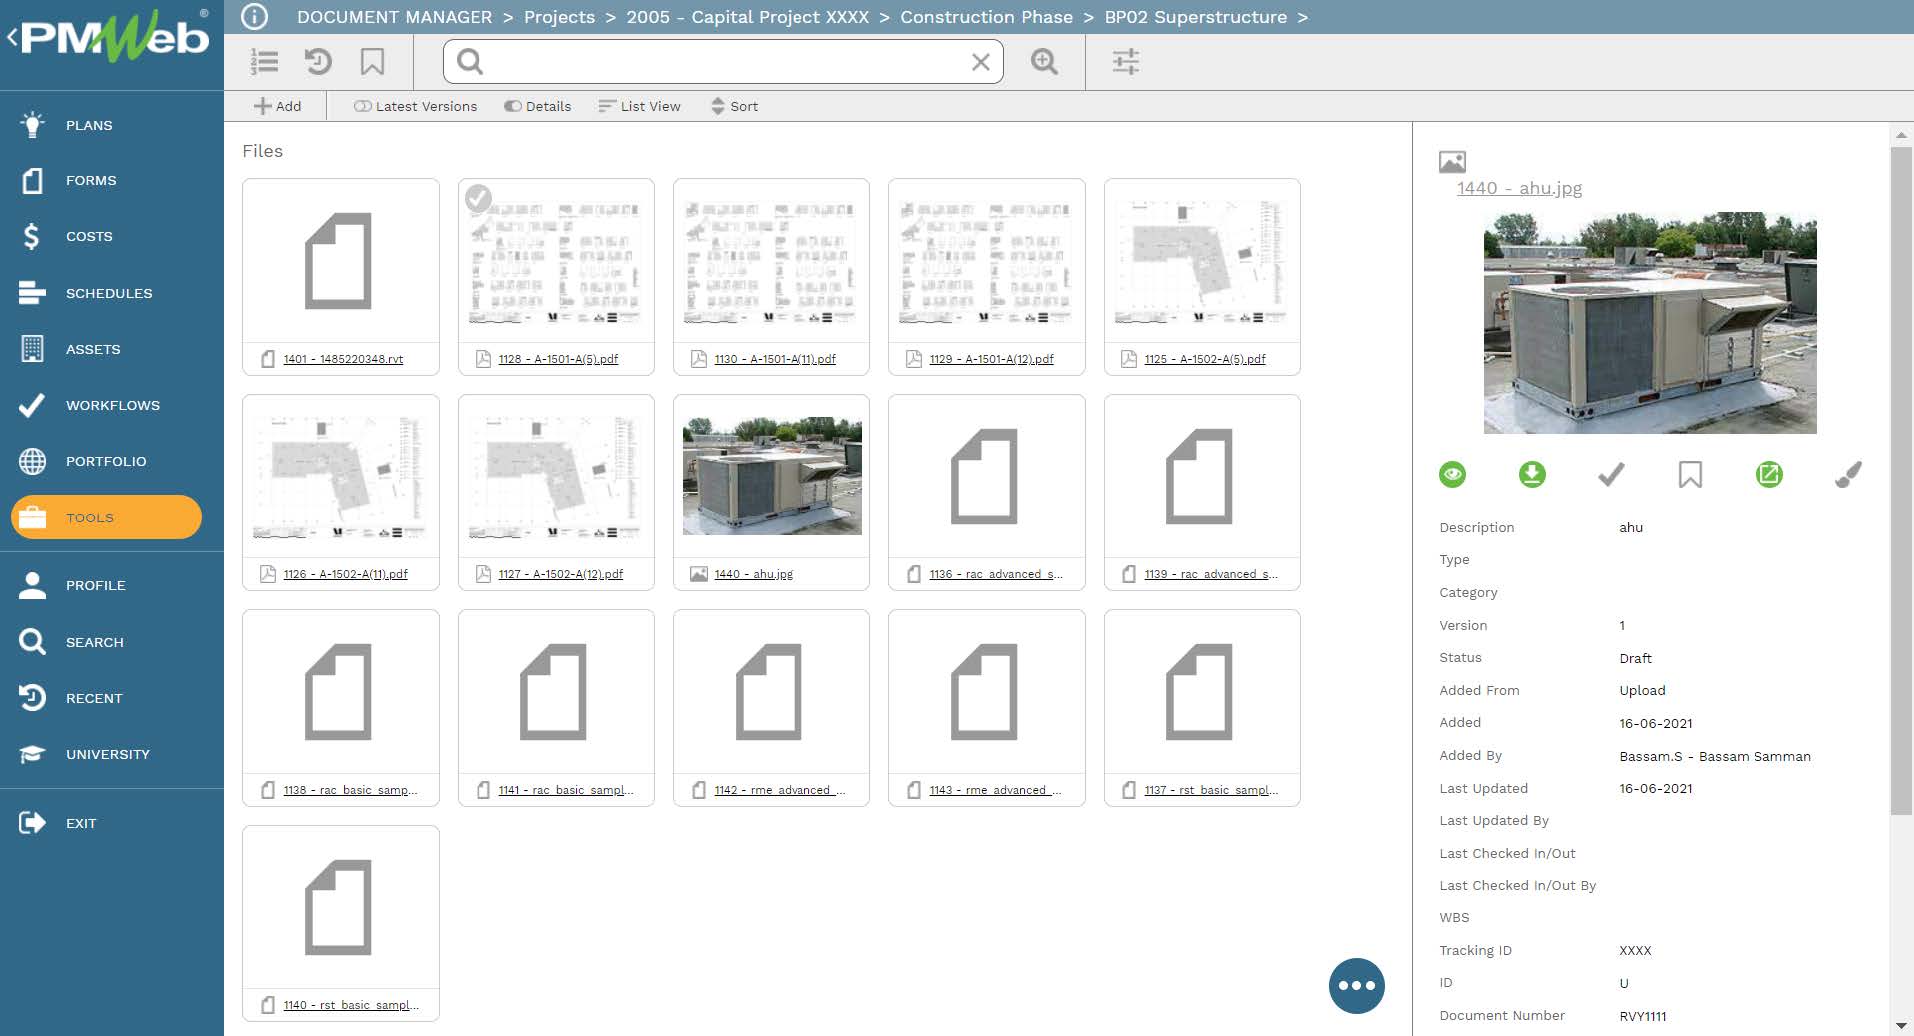
Upload all those supportive documents into the PMWeb document management repository to allow users to store and use them. PMWeb allows users to upload those do into organized and secured folders or subfolders. PMWeb allows setting access rights to each folder to identify the users who have access rights to view documents stored in a folder. In addition, PMWeb allows setting notifications for individuals to receive emails when users upload new documents or download or delete existing documents.
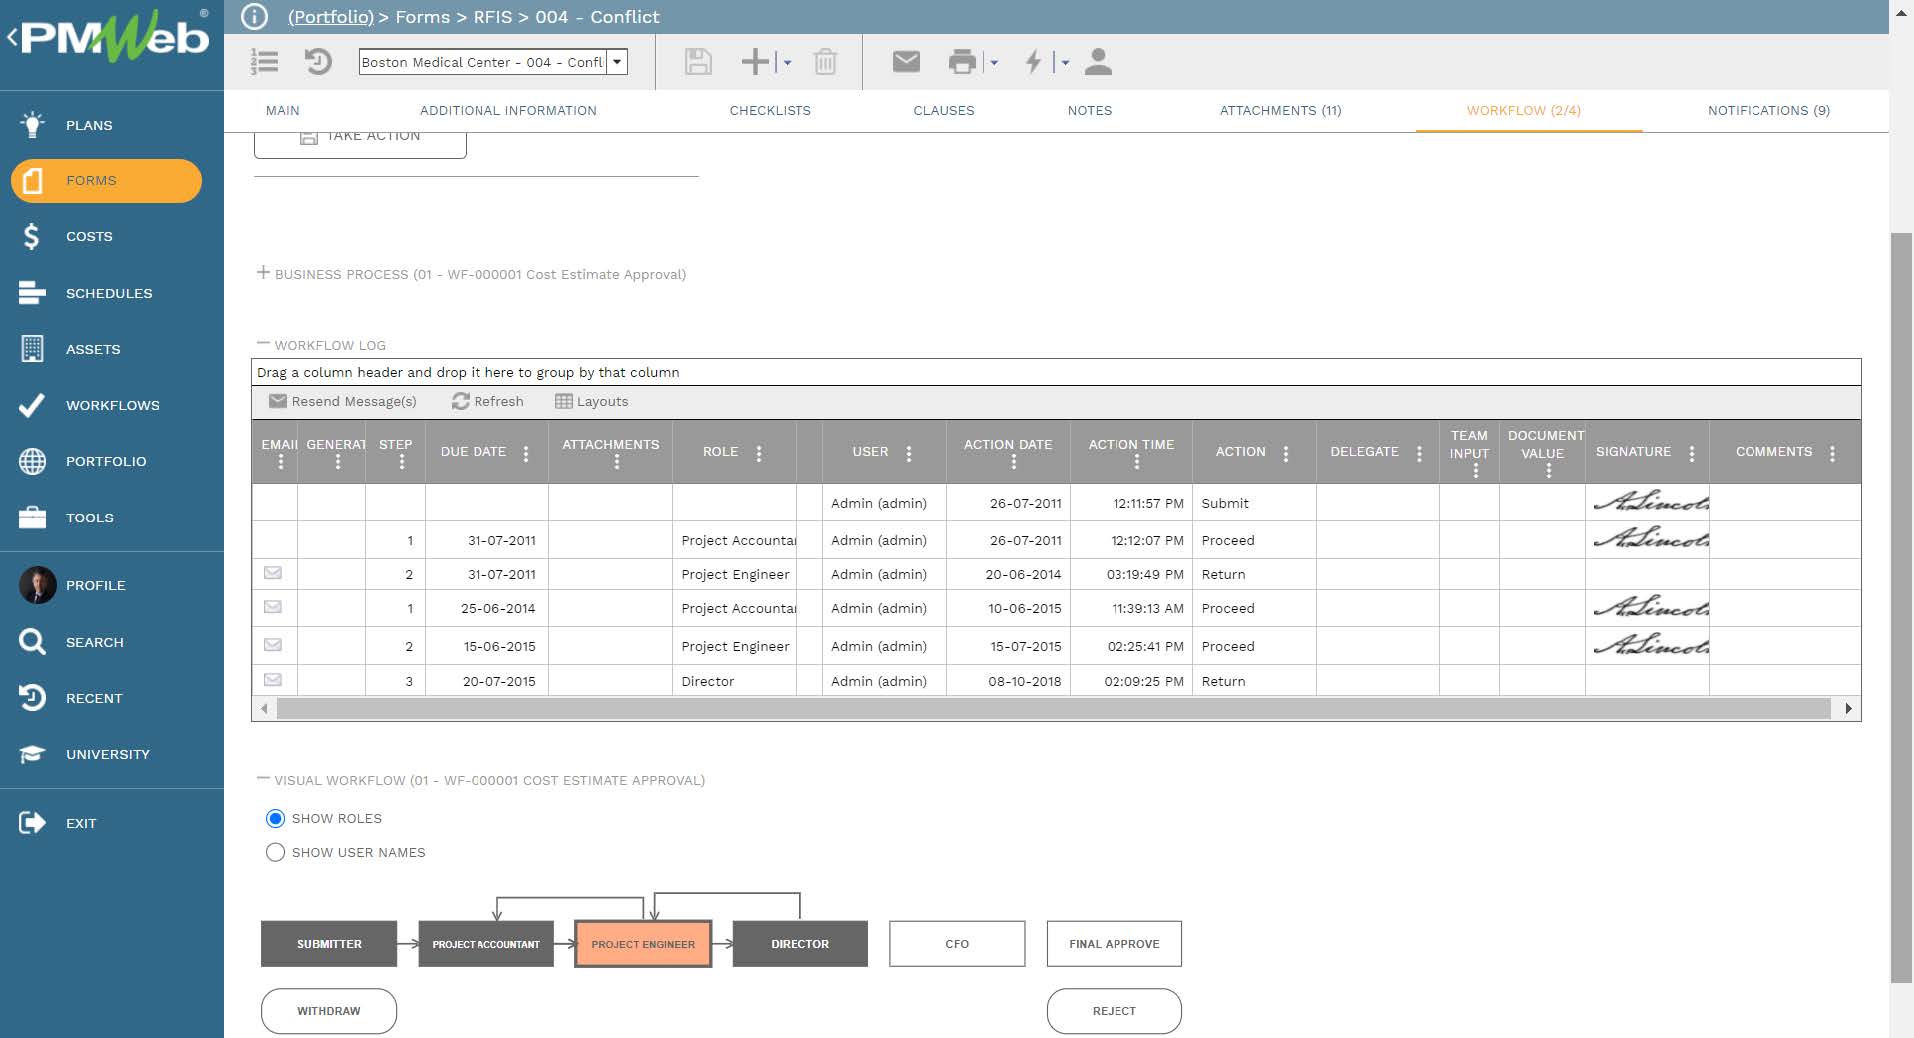
To enforce accountability for each submitted transaction of each business process, create a workflow to formalize the review and approval tasks of each business process in the PMWeb Workflow module. The workflow will map the sequence of the review and approval tasks along with the role or user assigned to the task, duration allotted for the tasks, rules for returning or resubmitting a document, and availability for each task. In addition, the design of the workflow could include conditions to enforce the authority approval levels as defined in the Delegation of Authority (DoA) matrix. All business processes that involve financial data usually require this.
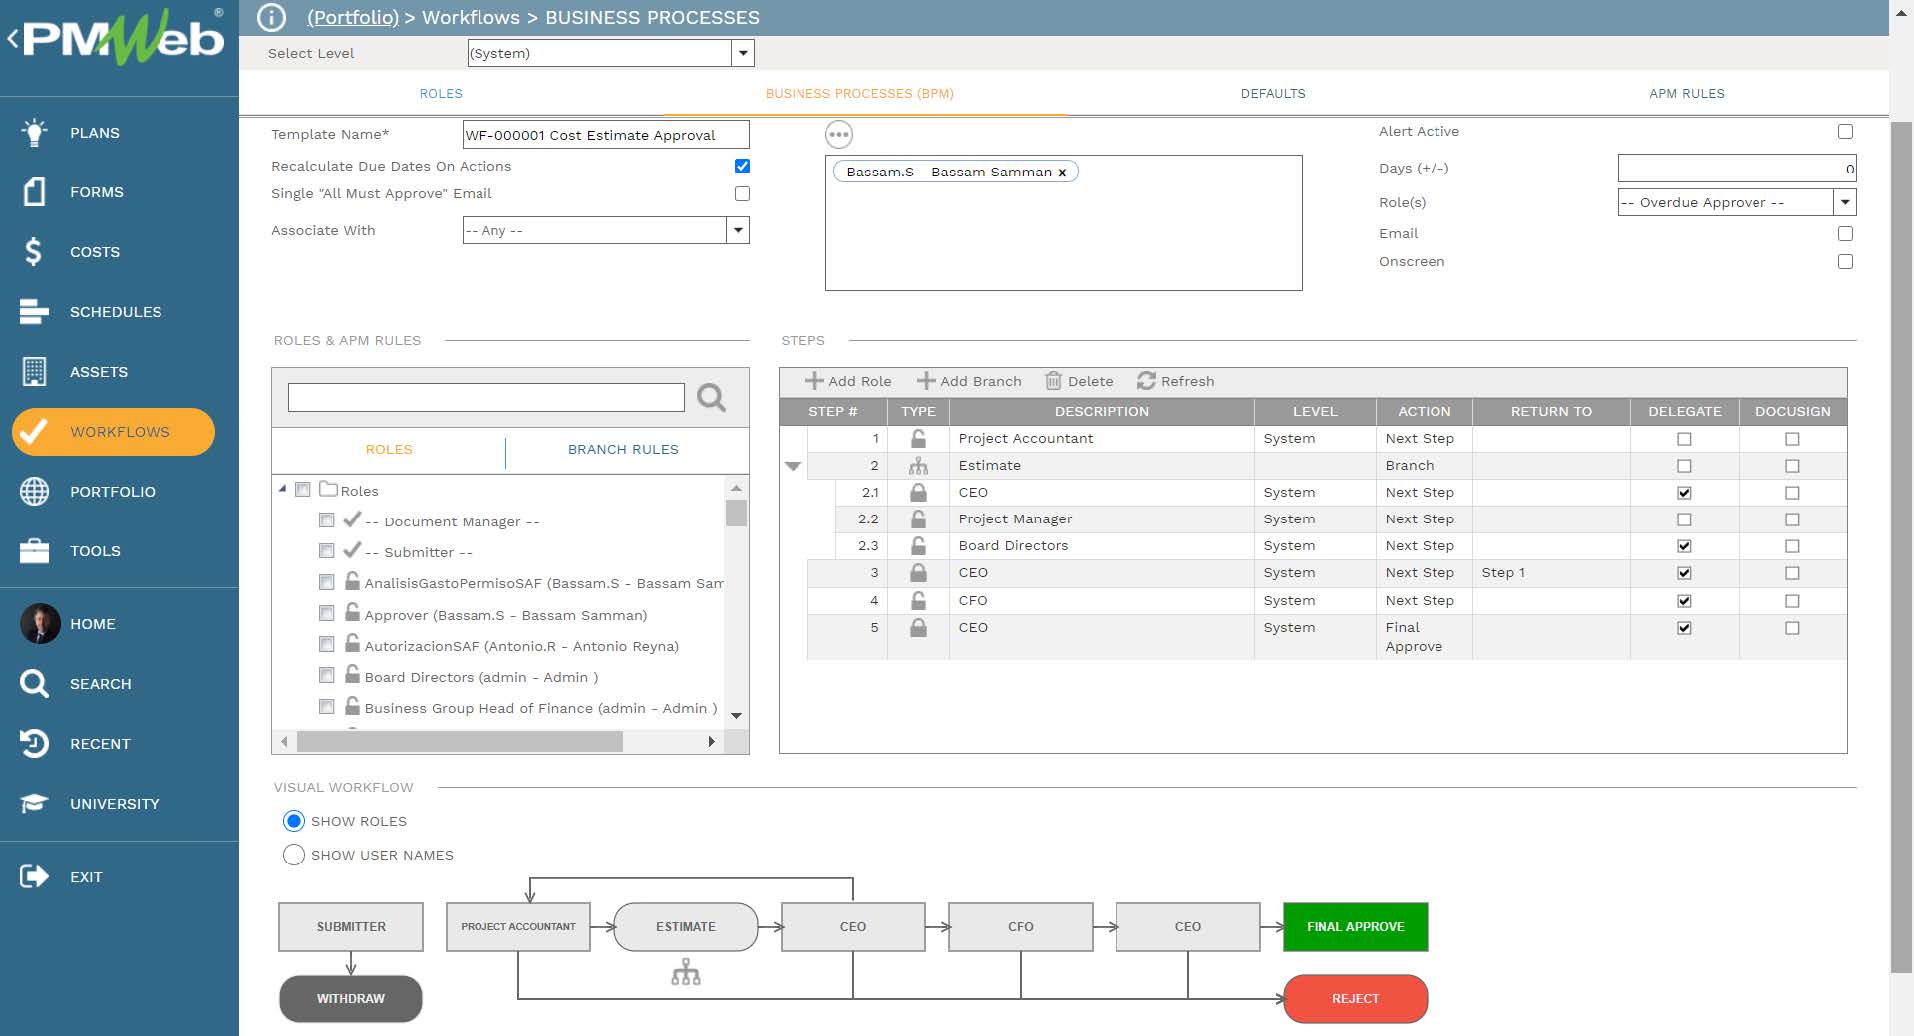
When initiating a transaction or record, the workflow tab available on the template captures the planned review and approve workflow tasks for each transaction. It will also capture the actual history of those review and approval tasks. PMWeb captures the actual action data and time, done by who, action taken, comments made, and any requested team input was requested.
