For many capital construction projects’ stakeholders and in particular executive stakeholders, they always need to know whether a project is facing cost overruns and/or delays in completion date in order to have an accurate cost performance. The earned value method (EVM) provides a proven solution to answer those two critical questions. Nevertheless, for most stakeholders, the terminologies used in EVM reporting might not be meaningful or relevant to them. Therefore, to increase the value of EVM reporting, it is highly recommended to replace the EVM terminologies with the terminologies that are understood by those stakeholders. Sometimes, those revised terminals need to also be communicated in languages other than English.
For example, the Budget at Completion (BAC) could be renamed as the Approved Budget whereas the Planned Value (PV) could be renamed as Approved Spending Plan. The Earned Value (EV) could be renamed as Work In Place and Actual Cost (AC) as Invoiced To Date. The Estimate to Complete (ETC), Estimate at Completion (EAC), and Variance at Completion (VAC) can be kept as this unless other terminologies need to be used. Similarly, the Schedule Variance (SV), Cost Variance (CV), Schedule Performance Index (SPI), and Cost Performance Index (CPI) will be kept as this unless they need to be modified. Finally, the Total Float (TF) will be renamed as Completion Delay.
Accordingly, a report can be designed to communicate each project cost and schedule performance status in a language that is best understood by project stakeholders. The report could include a map to show the boundaries of the project as well as a picture to show the current project’s construction status. The report also includes scorecards for each one of the EVM measures as well as the project’s total float value. The measures for Variance at Completion (VAC), Schedule Variance (SV), Cost Variance (CV), Schedule Performance Index (SPI), Cost Performance Index (CPI), and Total Float (TF) are colored either “Green” for when performance is ahead of what is planned, “Yellow” for when performance is borderline or “Red” for when the planned performance is behind. The report also includes a line chart that displays the curves for Planned Value (PV), Earned Value (EV), Actual Cost (AC), and Estimate to Complete (ETC). The report includes threshold lines for Data Date, Budget at Completion (BAC), Estimate at Completion (EAC), Planned Finish Date, and Current Finish Date. In addition, it is recommended to add a rectangular box to highlight the project’s current risk for cost overrun and delayed completion. The report has a filter to enable selecting the project to be reviewed. Of course, the report layout can be modified to display other performance information that could be required by the stakeholders.

Although having a report that is worth thousands of words is of great value, nevertheless, this value can easily diminish and even cause end up causing harm to the readers if the reported project’s performance data was not accurate, valid, or traceable. In other words, without a trustworthy data source, those reports have virtually no value.
This issue can be overcome when a Project Management Information System (PMIS) like PMWeb is used as the single data source for capturing the performance data for the complete projects’ portfolio that an organization has. PMWeb allows you to create a trustworthy Communicating Schedule and Cost Performance Status report. For example, PMWeb comes ready with the Budget module which is the basis for capturing the approved baseline budget as well as the approved budget spending plan. PMWeb also comes ready with the Budget Request module capturing all budget omissions, additions, and transfers. For each transaction for budget or budget request business processes, PMWeb allows attaching all supportive documents and adding links to other relevant business processes. In addition, a workflow can be assigned to each of the two business processes to formalize the submit, review and approve tasks. The workflow could include conditions to formalize the approval authority levels as set in the Delegation of Authority (DoA) matrix.

On the other hand, the PMWeb Progress Invoices module captures the data for Actual Cost (AC) or progress invoices against approved contracts. Unlike the issues that are usually faced by all ERP and Accounting systems where only approved progress invoices are recognized as actual cost, PMWeb allows calculating the Actual Cost (AC) for all submitted progress invoices whether they are approved or pending approval.
This eliminates the need to have the accrual business process used by ERP and accounting systems to capture the details of progress invoices that have been received but not yet approved. Those accrual transactions are then deleted after closing the monthly cost status report. Not only does this eliminate the wasted effort in implementing a workaround transaction, but it also carries the risks of wrong data entries as well as delays in providing this data. PMWeb forecast report displays the reported Actual Cost (AC) and the calculated Estimate to Complete (ETC) values as well as the Earned Value (EV).

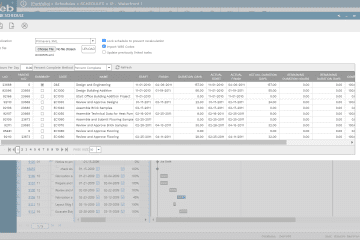
In addition, the PMWeb Schedule module serves two purposes. The first is to capture the percent complete values assigned to activities that are associated with the project budget. This enables calculating the Earned Value (EV) for each cost center. The second is capturing the schedule activities’ start and finish dates as well as the Total Float (TF) values.