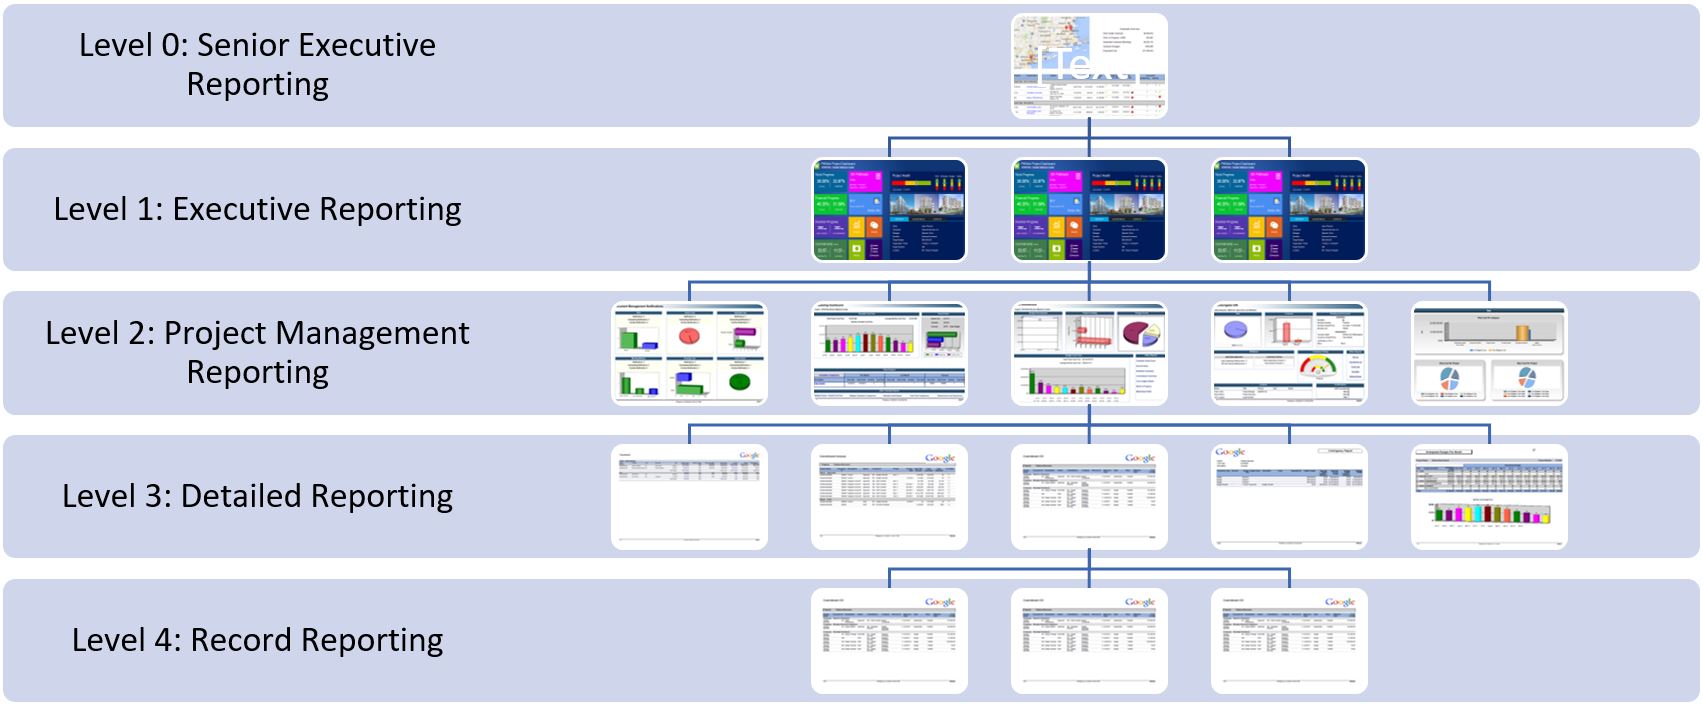
For a trustworthy, credible, and traceable performance reporting on capital construction projects, the reporting should be bottom-up. Therefore, Level 4 Record Reporting of each transaction of each business process managed on a project is reported on and consolidated in the Detailed Reporting or Level 3. Then, Level 3 provides the necessary input for Level 2 Project Management Reporting, which in turn provides the input to Level 1 Executive Reporting. Level 1 Executive Reporting provides the reporting input for Level 0 Senior Executive Reporting who need an overall performance report for the complete projects’ portfolio that the organization is managing,The input data for Level 4 Record Reporting is the data captured in each transaction and documents generated from the hundred-plus business processes needed to manage the capital construction project delivery. Those business processes include the business processes needed to manage the project’s schedule, cost, quality, health, safety and environment (HSE), communications, site activities, risks, procurement, contract, sustainability, and claim management. For each business process, there is a predefined template to capture all data required to enable managing the business process in accordance with the approved project management plan (PMP).
The PM Handbook for EPC by Frank-Peter Ritsche https://project-team.org/beispiel-seite/ details many of those business processes as well as provides a list of some of the most critical reports that need to be made be available at the detailed level. Each organization can decide on whether to digitize all of the business processes required to deliver the capital construction project or not. The benefits of digitizing those business processes first ensures the transparency, accountability, validity, traceability, and security of the captured data. Secondly, it makes this data available to automatically provide the information needed for the five levels of the performance reporting.
A Project Management Information System (PMIS) like PMWeb is designed to manage, monitor, evaluate, report, and capture the data from each business processes transaction needed for a capital construction project delivery. This is achieved through the digitization of the hundred-plus business processes by providing the input template to capture the needed data and the workflow to enforce formal collaboration as defined in the project management plan while incorporating the authority approval levels associated with each business process.
All the data and associated documents used in generating the required information are captured and stored on a single database repository for the complete projects’ portfolio across the complete globe. The captured data provides the real-time feed of information to be used for all reports needed for the five levels of performance reporting. Those reports, which can be designed in any form or format to fulfill the reporting and branding requirement of every single organization and even a program or a project, allows presenting the business processes information in tabular and graphical visuals to address the needs of what to be shared and in what format.Starting with the Record Reporting or Level 4, PMWeb can be used to create the output template for every business process. Nevertheless, this is a given fact and maybe the only important value of those output forms is that they are needed for formal communications that are required on every capital construction project.
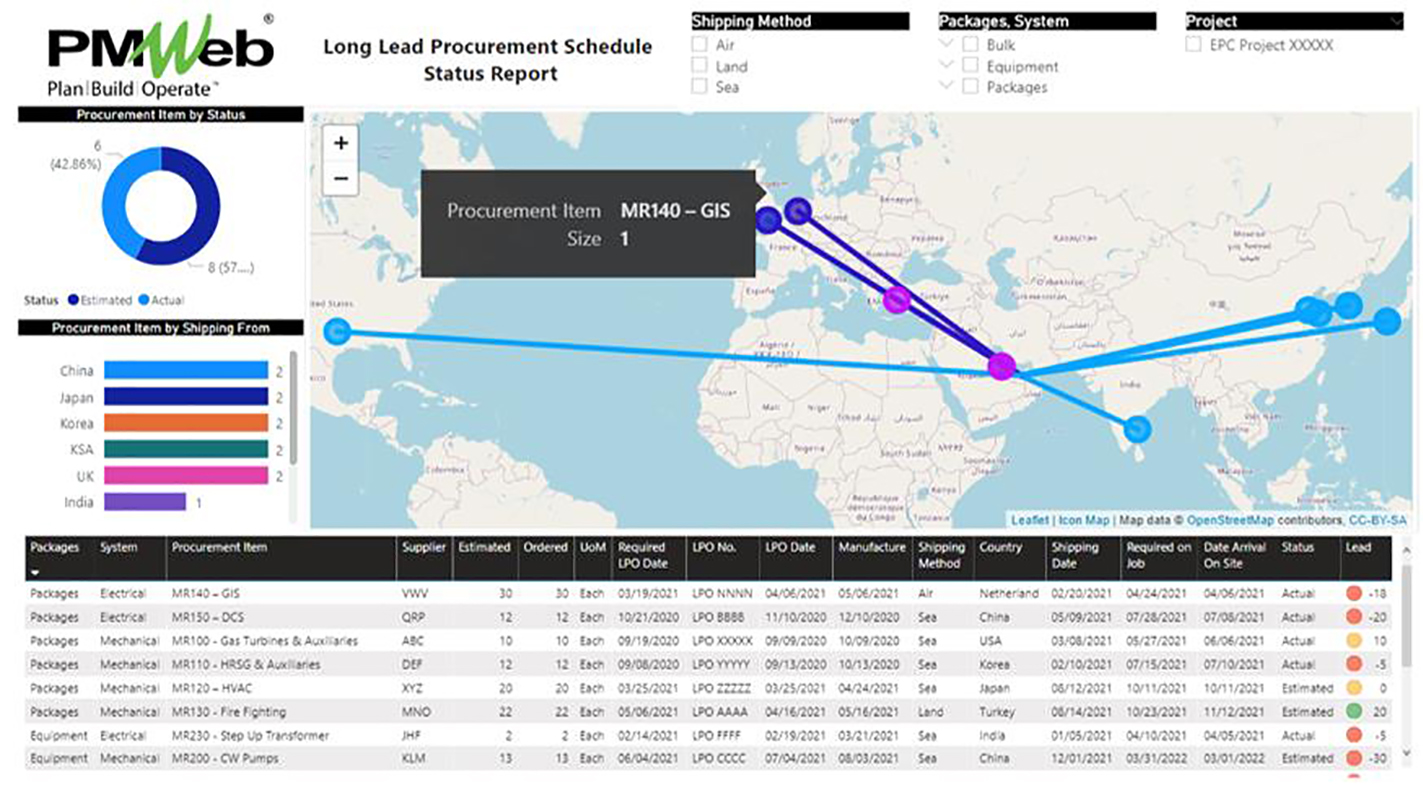
Nevertheless, the value that digitizing the business processes brings is the ability to review the record details in a more meaningful format. For example, for the Long Lead Procurement Report which is a Level 3 Detailed Report, the reader can drill down to view the details of every equipment or material procured for the project. The Level 4 Record Report can include a map to track the actual shipment status of the equipment or material.
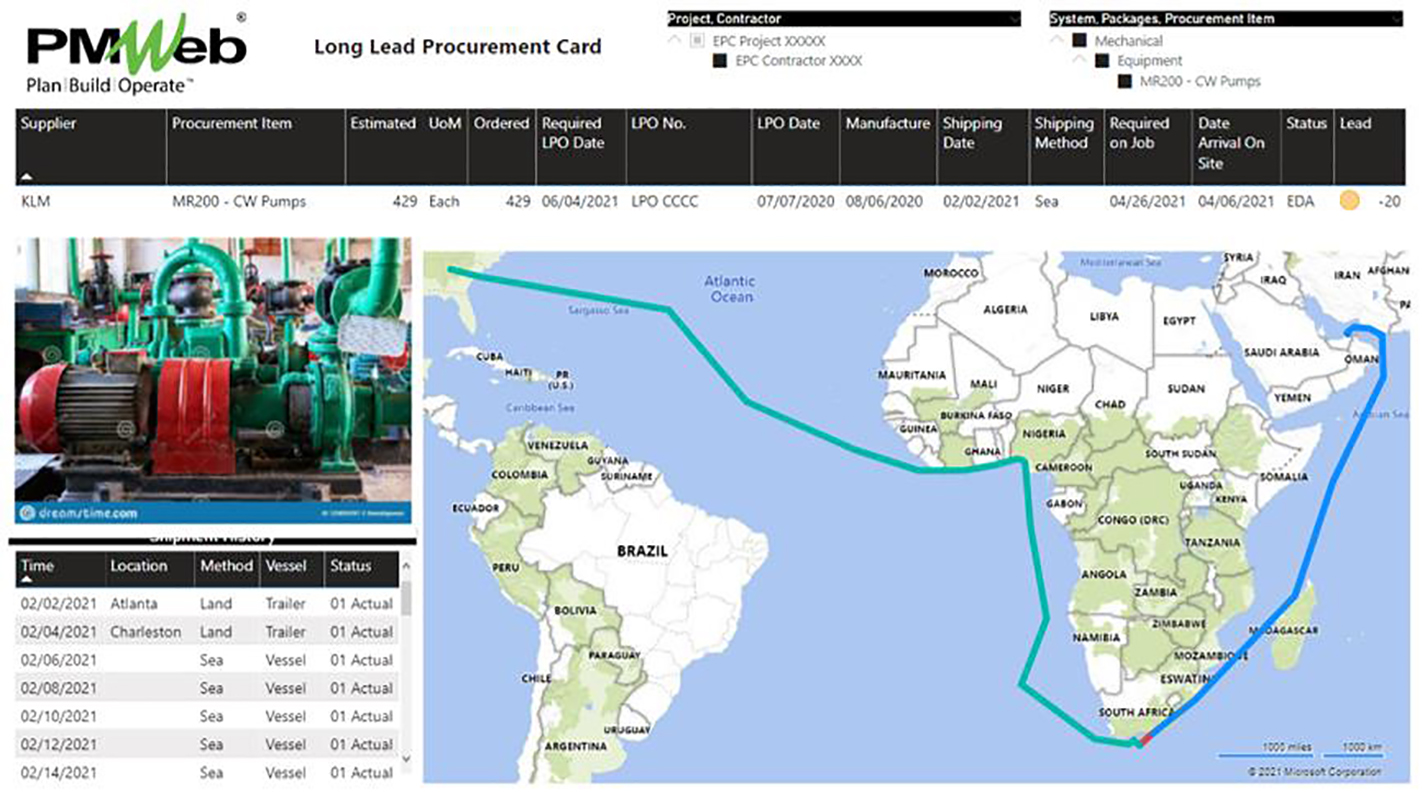
The Level 3 Detailed Reporting provides a consolidated report of all long lead procurement items which is based on the same data source used for Level 4 Record Reporting. Adding the map and other visuals to the Long Lead Procurement report provides the project stakeholder with a better insight into how this business process is performing.
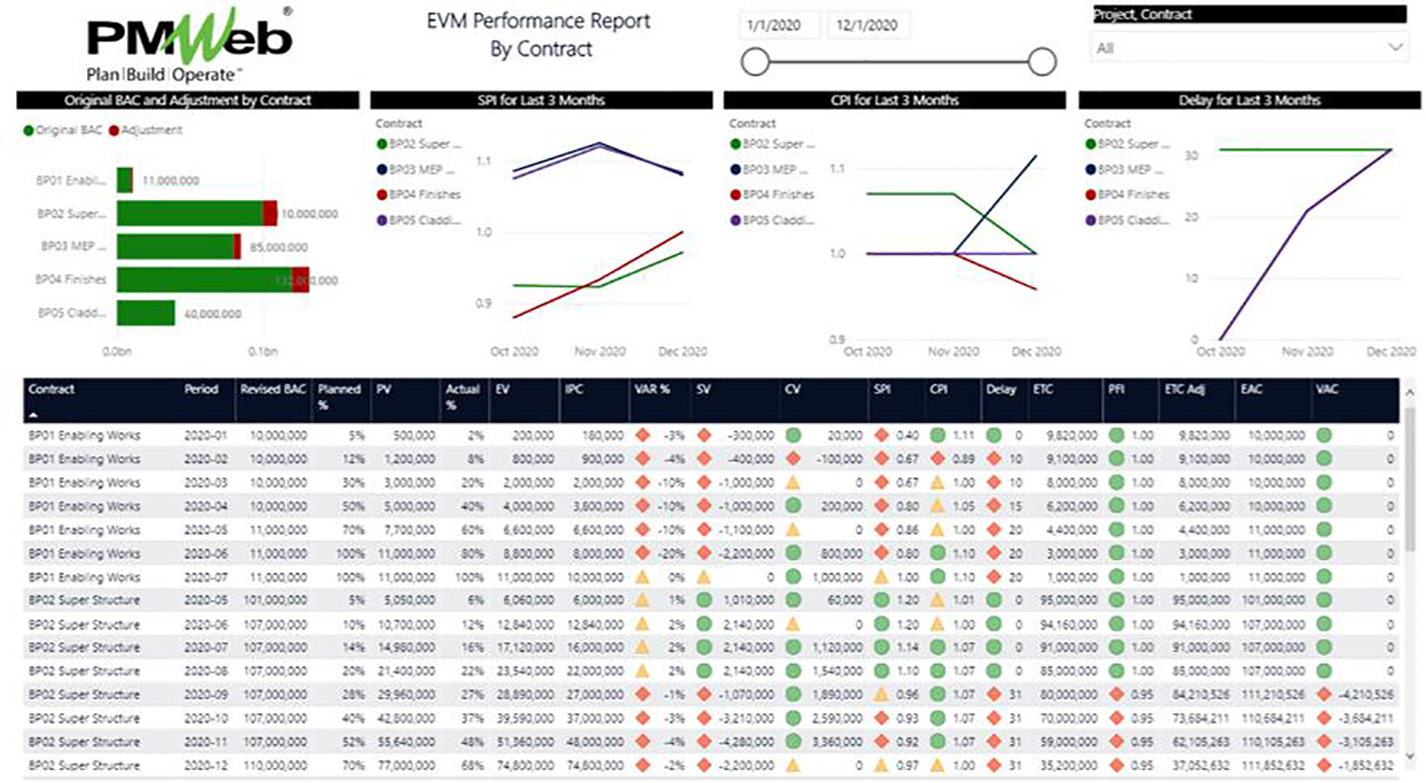
Many times, for Level 3 Detailed Reporting to be meaningful, it requires combining data from different business processes. For example, when it comes to cost reporting using the Earned Value Management (EVM) method, the report needs to capture the data from the Budget, Forecast, and Progress Invoices as a minimum. Another example is when a detailed report is generated to provide details of the labor resources productivity rate for completed work in the plan.
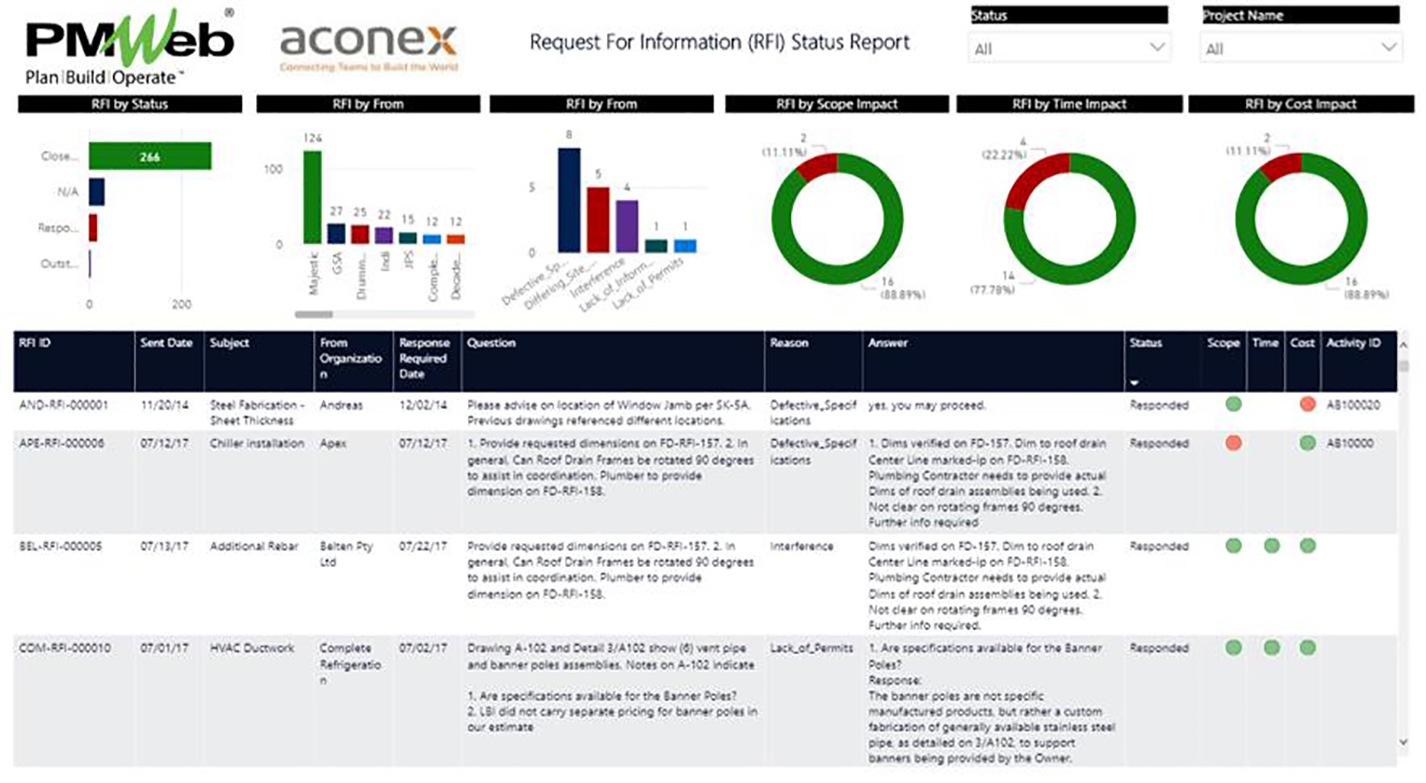
Combining data is not limited to combining data from different business processes managed in PMWeb but might also include associating PMWeb data with data from other data sources. Those data sources could be documents that are managed in a document management system other than PMWeb like for example Aconex. Having reports that combine data from different data sources does not always require integration between those applications. It is important to have common data fields between those applications like Project No., Work Breakdown Structure (WBS), etc. to associate, blend and report on the combined data.
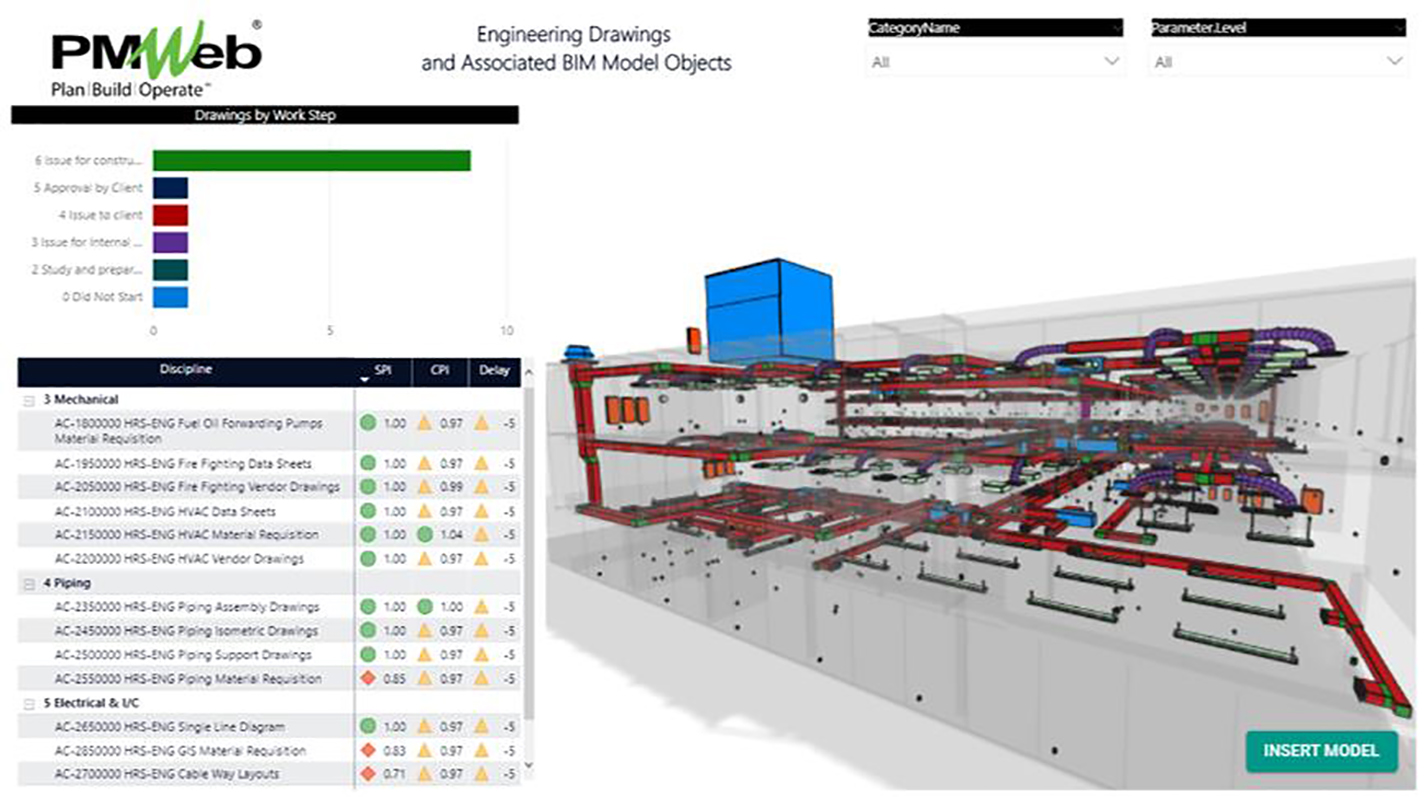
Another example of combining data from multiple applications data sources is the associate of PMWeb business processes data with a Building Information Model (BIM) data and visual. This requires that PMWeb business processes have a user-defined field for the BIM object ID generated from the BIM authoring tool. The BIM object ID becomes the basis for associating and visualizing the PMWeb data on the BIM model.
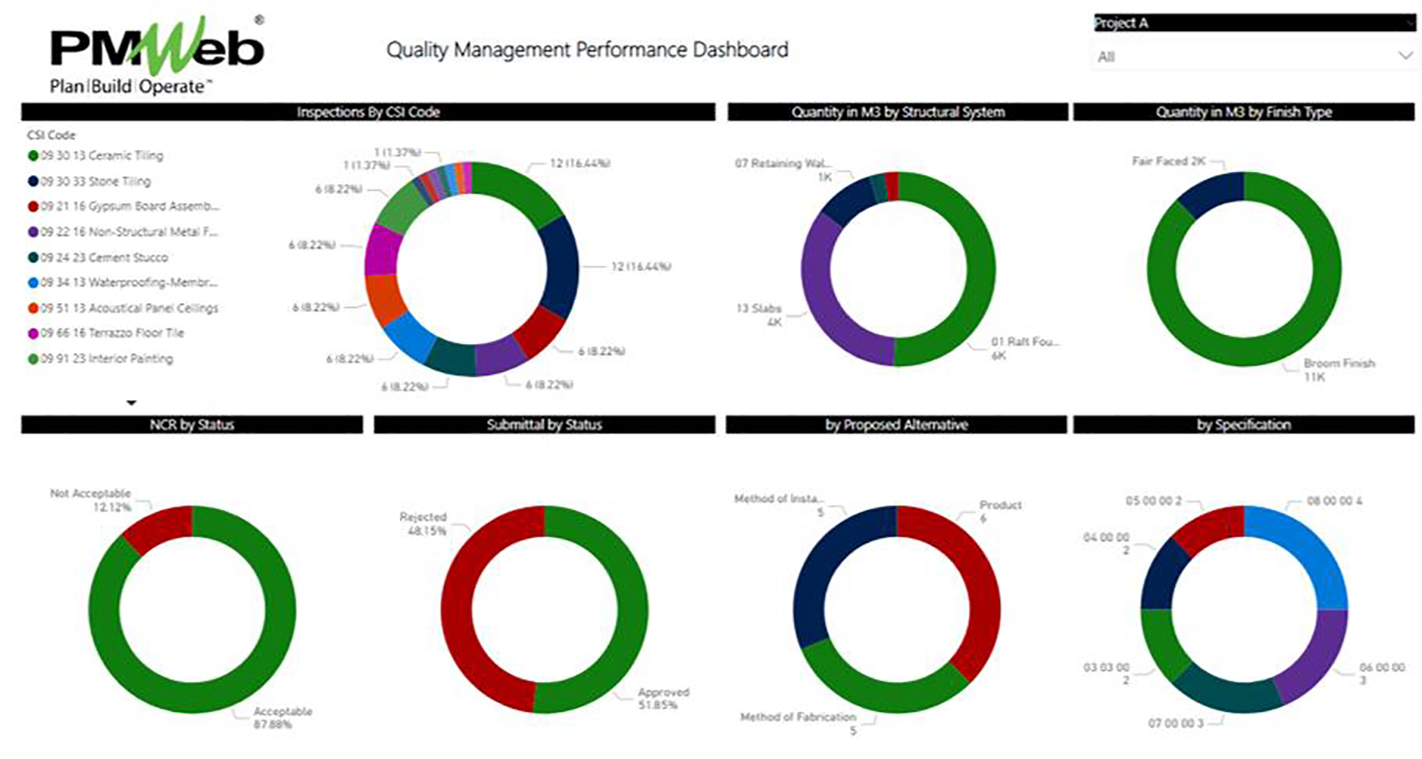
Lever 2 Reporting or Project Management Reporting consolidates the data captured in all transactions for each business process that belongs to a project management function. For example, there could be dashboards for Cost, Time, Risk, Quality, Health, Safety and Environment (HSE), Procurement, Contract, Communications, Sustainable Development, and other areas. The reader of a Level 2 Project Management Reporting can drill down to any of the detailed business process reports that are part of the Level 3 Detailed Reporting. Of course, the reader can also drill down to any specific record included in the detailed report which is defined as Level 4 Record Reporting.
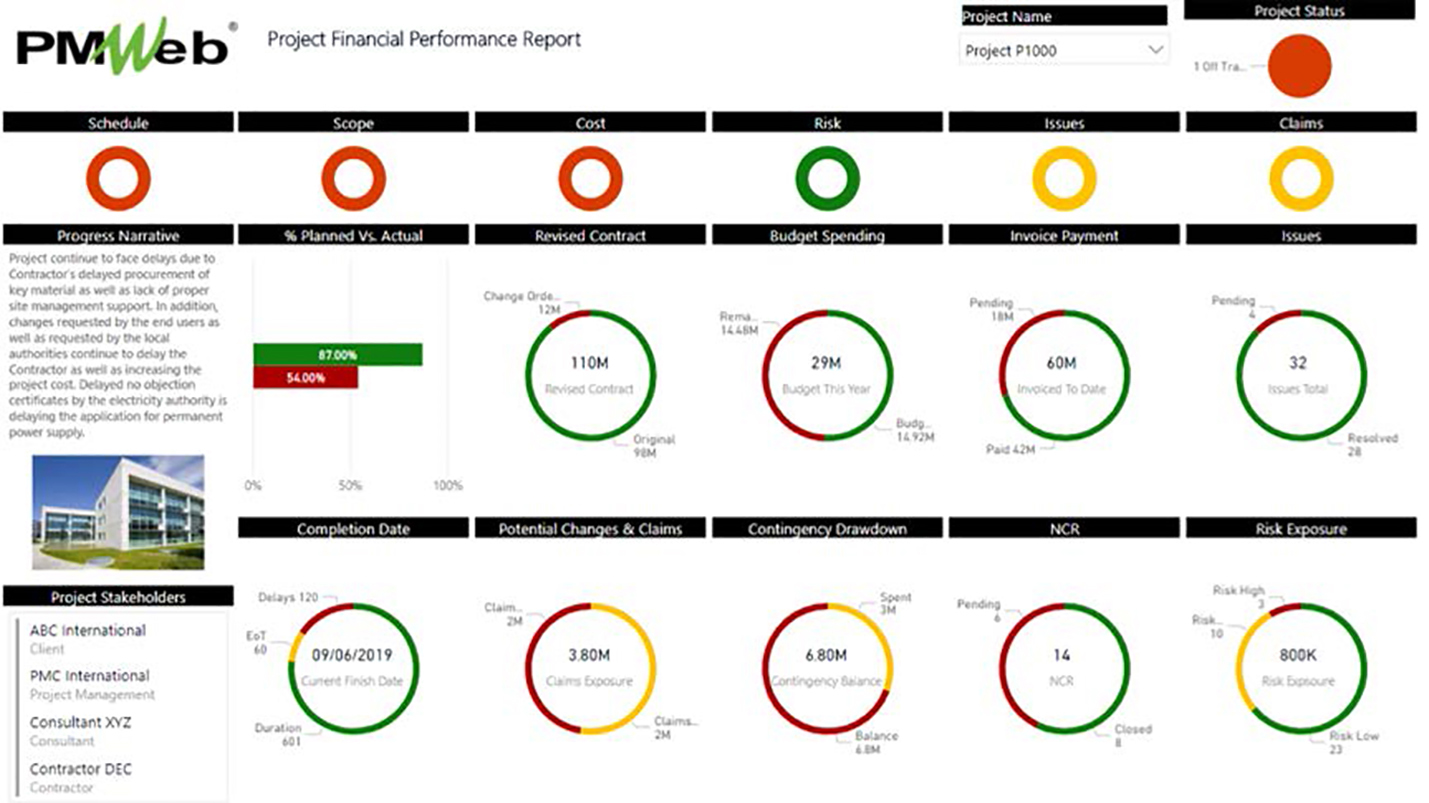
The data captured in all transactions of all business processes also is the source of information for Level 1 Project Reporting. The project dashboard is usually designed to detail the performance of key business processes to provide what is known as Key Performance Indicators (KPI). The reader of the project performance dashboard can drill down to any Level 2 Project Management Report to have more insight on the performance of that perspective which could be cost, time, quality, HSE, procurement, contract, risk, or others.
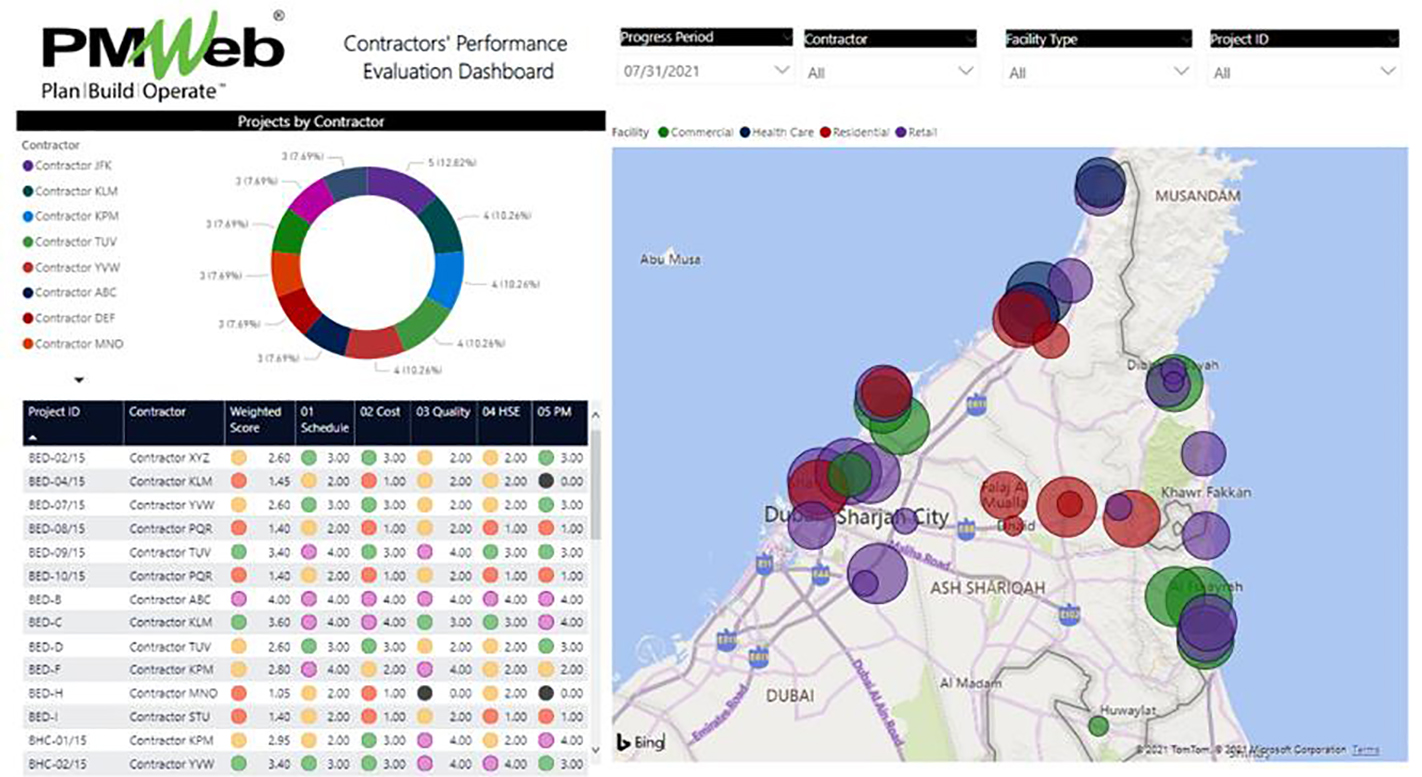
Finally, is Level 0 Portfolio Reporting for which stakeholders are keen to have an overall preview of how each project in their projects’ portfolio is performing. Those reports usually include a map showing the locations of the organization’s projects along with the key performance indicators values. Progress pictures can be also added as well as other visuals to provide more meaningful reporting.
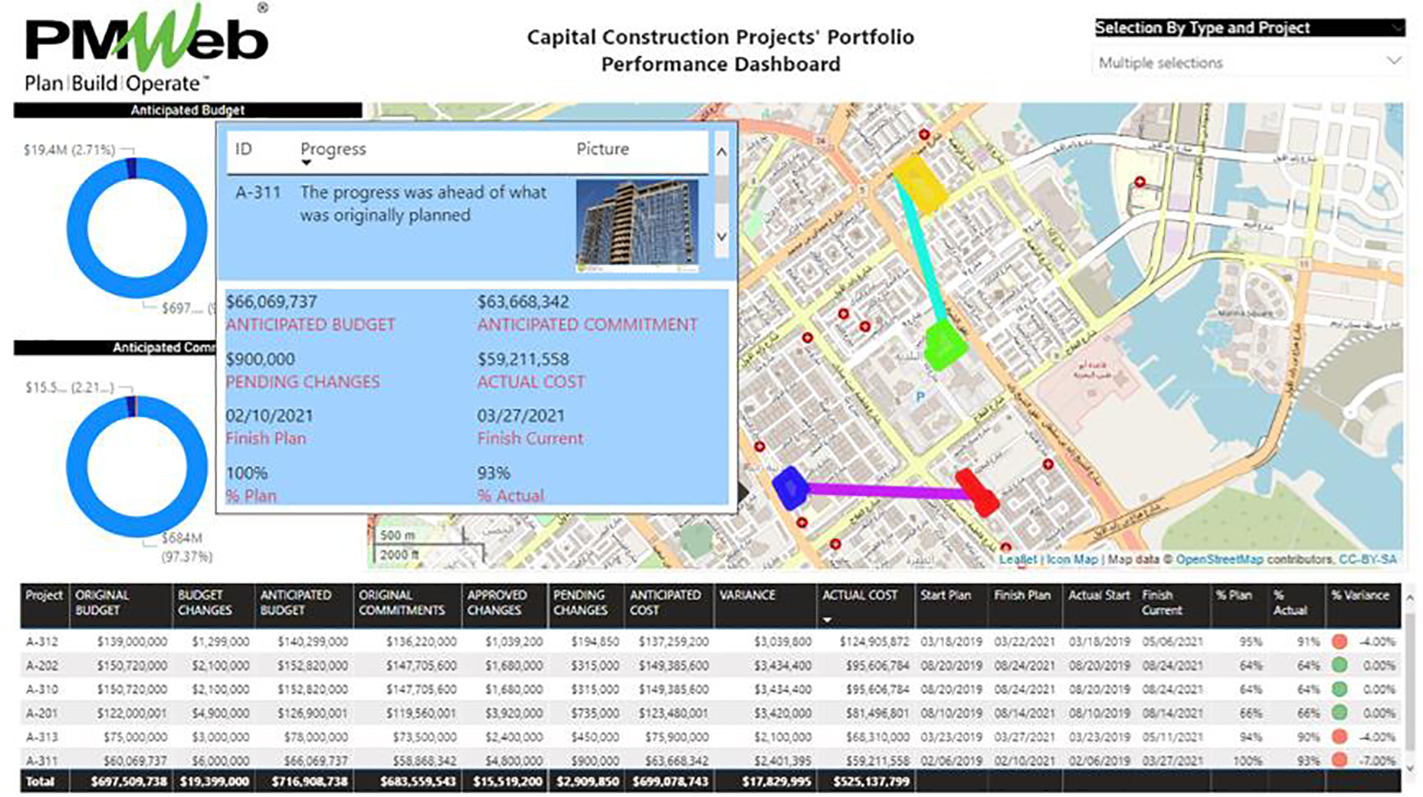
Also design Level 0 or Portfolio Reporting to report the performance of specific project management or business process. For example, a portfolio performance report can report on the performance of each contractor who has worked or working with the organization. Another example could be for portfolio reporting for projects’ cost, quality, risk, procurement, contract, health and safety, sustainable development, and others.
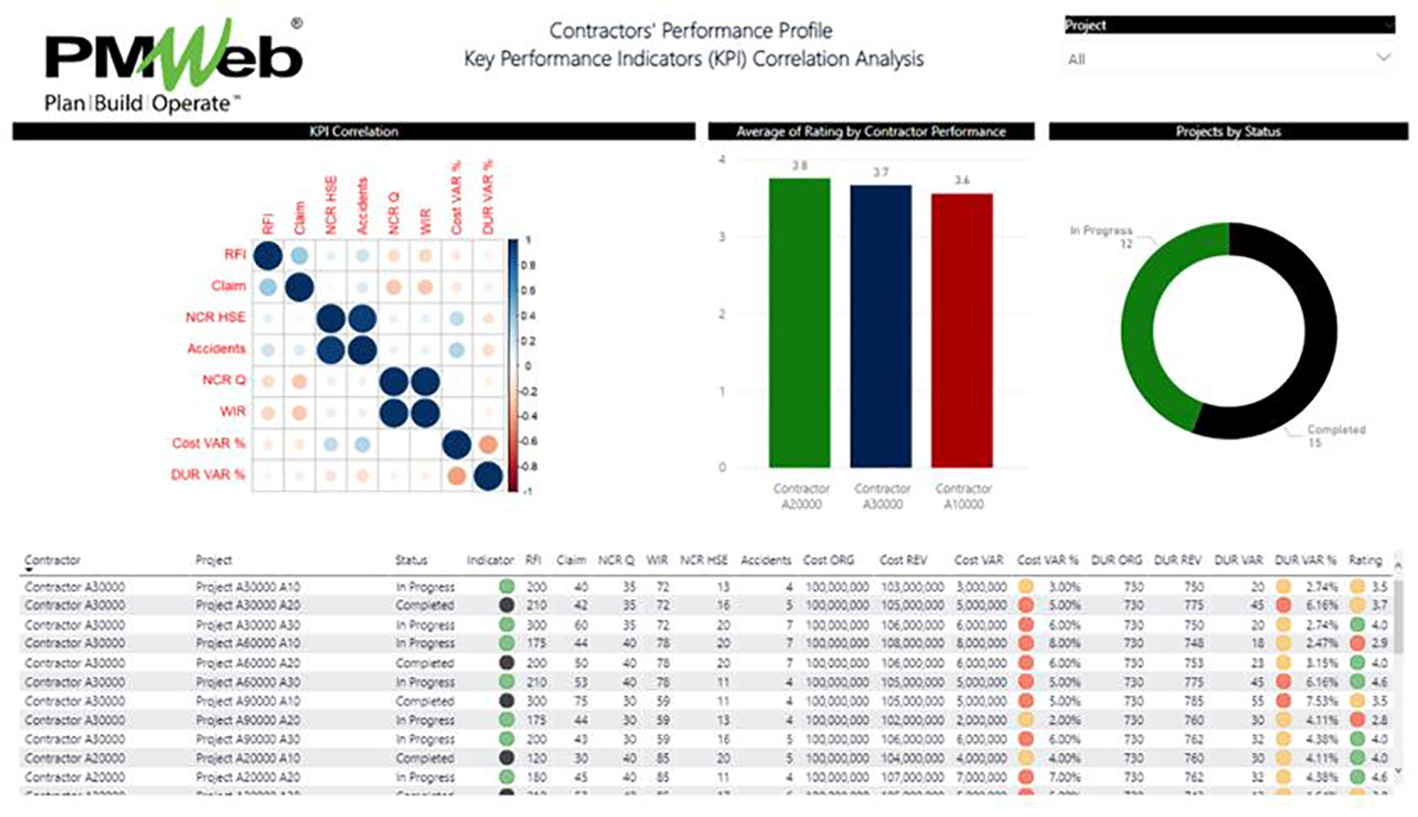
Finally, having access to the great wealth of trustworthy, valid and real-time data is that it gives the project management team the ability to investigate the captured to identify performance trends and correlations between different business processes. For example, the correlation logarithm automatically identifies the degree of correlation between different business processes at a project level or the complete projects portfolio. This type of analysis is one of the machine learning (ML) logarithms that is needed for deploying Artificial Intelligence (AI) that has positive impacts on the delivery of capital construction projects.